LiveBench vs Artificial Analysis vs TokenDyno: Which LLM Benchmark Fits Your Need?
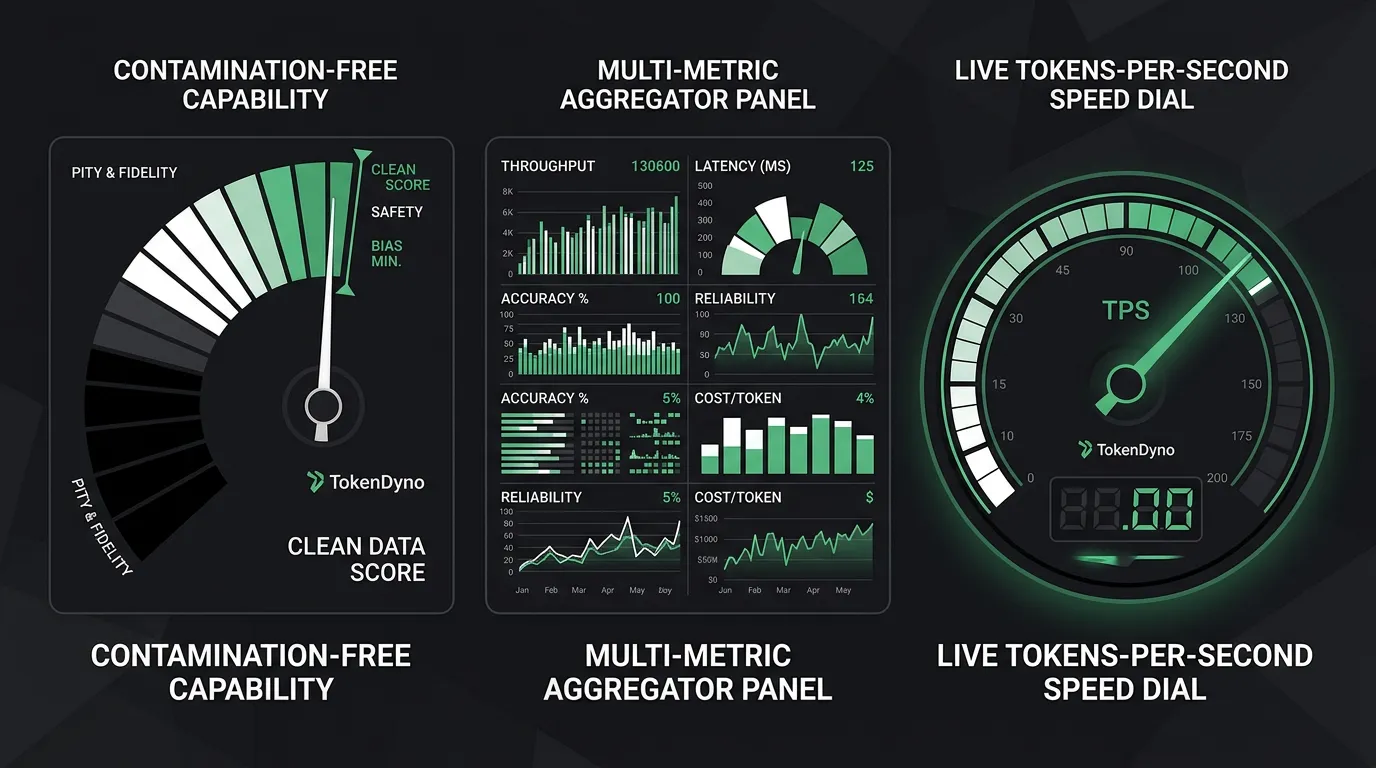
“LiveBench vs Artificial Analysis” is the wrong framing if you expect one winner. These tools measure different things, and TokenDyno measures a third. LiveBench scores contamination-free capability, Artificial Analysis aggregates capability, speed, and price, and TokenDyno tracks live tokens-per-second across providers. This guide explains what each genuinely does, where they overlap, and how to pick the one that answers your question, treating them as complements rather than substitutes. Aggregators like these are usually where model-ranking searches end up, which we unpack in why LLM leaderboard searches land on aggregators.
Which benchmark should you use?
Use LiveBench when you need a clean, contamination-resistant read on how capable a model is. Use Artificial Analysis when you want capability, speed, and price compared in one place. Use TokenDyno when you need live, high-frequency tokens-per-second on specific providers. Many teams consult all three.
The three tools answer three different questions: “Is this model actually smart?” (LiveBench), “What is the overall capability-speed-price tradeoff?” (Artificial Analysis), and “How fast is it serving output right now?” (TokenDyno). The table below summarizes each before the sections that follow break them down. For broader context on the leaderboard landscape, see LLM Leaderboards Compared.
| Tool | What it measures | Refresh cadence | Best for | Source |
|---|---|---|---|---|
| LiveBench | Contamination-free capability across 7 task categories | ~1/6 of questions monthly; full refresh ~6 months | A clean capability signal resistant to training-data leakage | livebench.ai |
| Artificial Analysis | Capability (Intelligence Index) + output speed + price + latency | Intelligence updated per model release; performance measured on a recurring schedule | Comparing the capability-speed-price tradeoff in one view | artificialanalysis.ai |
| TokenDyno | Live tokens-per-second, TTFT, and reliability across providers | Benchmarked continuously — every ~10 minutes on Ollama Pro, ~60 minutes on capped plans | Live serving speed on specific provider endpoints | tokendyno.com |
What does LiveBench measure?
LiveBench measures large-language-model capability using objective, contamination-resistant questions. It currently spans 23 tasks across seven categories, reasoning, coding, agentic coding, mathematics, data analysis, language, and instruction following, each with verifiable ground-truth answers and no LLM judge (Source: LiveBench, 2026). It does not measure inference speed or cost.
LiveBench was developed by researchers affiliated with NYU and Abacus.AI, with contributors including Yann LeCun, Colin White, and Tom Goldstein, and introduced in a 2024 paper (Source: White et al., arXiv:2406.19314, 2024). Its defining goal is to resist the contamination that inflates scores once benchmark questions leak into training data. That single design choice, freshness over familiarity, is what separates it from older static tests like the original MMLU.
How does LiveBench stay contamination-free?
LiveBench uses four layers of contamination resistance. First, it refreshes questions on a monthly cadence, replacing roughly one-sixth of the dataset each release, prioritizing the oldest and easiest items, so the benchmark is fully rotated about every six months (Source: LiveBench, 2026). Second, newly added questions are held private for one month before public release, so developers cannot fold them into training pipelines first.
Third, new questions are drawn from recent material such as newly published arXiv papers, recent math-olympiad problems, and current events. Fourth, every question has an objective, automatically computed answer, eliminating the subjective LLM-judge step that other benchmarks can learn to game (Source: White et al., 2024). The tradeoff: because the test set rotates, scores carry an implicit timestamp and are not perfectly comparable across distant months.
What does LiveBench not measure?
LiveBench is a capability benchmark only. It tells you nothing about how fast a model serves tokens, how much it costs per million tokens, or how a specific provider’s endpoint performs under load. A model can top LiveBench and still be too slow or too expensive for your product. That gap is exactly where speed-and-price tools enter, which is why LiveBench pairs naturally with the other two rather than replacing them.
What does Artificial Analysis measure?
Artificial Analysis measures three axes at once: capability, speed, and price. It publishes a composite Intelligence Index for capability, an output-speed figure in tokens per second, latency metrics like time-to-first-token, and per-token and per-task pricing, so a single model page shows the full tradeoff (Source: Artificial Analysis, 2026). It is best described as an aggregator.
This breadth is its main strength. Where LiveBench answers one question precisely, Artificial Analysis lets you weigh “smart but slow and pricey” against “good enough, fast, and cheap” without leaving the page. For a wider survey of capability rankings, see the LLM Leaderboard 2026.
What goes into the Intelligence Index?
The Artificial Analysis Intelligence Index is a composite that aggregates multiple hard evaluations. Version 4.1 combines GDPval-AA v2, τ³-Banking, Terminal-Bench v2.1, SciCode, Humanity’s Last Exam, GPQA Diamond, CritPt, AA-Omniscience, and AA-LCR into a single score, with leading models reaching the 40-55 range (Source: Artificial Analysis Intelligence Index, 2026).
For speed, Artificial Analysis defines output speed as the average tokens received per second after the first token arrives, measured after any reasoning time for reasoning models. Figures represent the model’s first-party API where one exists, or the median across providers where it does not (Source: Artificial Analysis methodology, 2026). It also reports time-to-first-token and a composite latency-to-500-tokens metric.
Where does Artificial Analysis fit?
Artificial Analysis fits the “I need the whole picture in one view” use case. Because it spans capability, speed, and price, it is the natural starting point for model selection and budgeting. Its speed numbers are measured under controlled, repeated workloads rather than continuously in real time, and it compares models within peer groups, reasoning models against reasoning models, which is worth remembering when reading its rankings (Source: Artificial Analysis methodology, 2026).
What does TokenDyno measure?
TokenDyno measures live inference speed. It benchmarks models on a provider-dependent loop — roughly every ten minutes on Ollama Pro, roughly hourly on the capped provider plans — and reports tokens-per-second now, a 24-hour average, time-to-first-token, 24-hour reliability, a 24-hour trend, and when each model was last tested, sorted by tokens per second (Source: TokenDyno, 2026). It is a speed specialist, not a capability test.
TokenDyno describes itself as a “live multi-provider benchmark” with “real inference speed, measured continuously” (Source: TokenDyno, 2026). Its focus is narrow on purpose: rather than scoring intelligence, it watches how specific provider endpoints actually perform from one sampling window to the next. For the speed-focused model picture, see Fastest LLM Inference in 2026.
What does live tokens-per-second across providers mean?
The same model served by different providers can differ in speed by a wide margin, and a single provider’s speed can drift across the day with load. TokenDyno tracks specific provider endpoints, currently spanning categories such as Ollama Free, Ollama Pro, OpenCode Zen, and OpenCode Go, and refreshes them continuously (Source: TokenDyno, 2026). That high-frequency, per-endpoint view is what a periodic snapshot cannot give you.
Reliability is reported alongside speed as a 24-hour percentage, which surfaces endpoints that are fast when up but frequently unavailable, a distinction that matters in production but is invisible on a capability leaderboard.
What does TokenDyno not do, and how does it use Artificial Analysis?
TokenDyno does not score model intelligence itself. Instead, it displays an Intelligence Index sourced from Artificial Analysis next to its own speed metrics, so you can read capability and live speed together (Source: TokenDyno, 2026). This is a concrete example of the three tools being complementary: TokenDyno consumes a capability signal from one of the others rather than reinventing it. It does not publish a contamination-free capability test of its own, and it covers the specific providers it benchmarks, not every model on the market.
How do the three compare on refresh cadence?
Refresh cadence is where the three tools differ most sharply. LiveBench rotates roughly one-sixth of its questions monthly, Artificial Analysis updates capability per model release and measures performance on a recurring schedule, and TokenDyno re-benchmarks speed every ten minutes on Ollama Pro, roughly hourly on Ollama Free and OpenCode Zen, and roughly every half hour on OpenCode Go for its standard-tier models (roughly every six hours for its most expensive models) (Sources: LiveBench, 2026; Artificial Analysis, 2026; TokenDyno, 2026).
That spread is not accidental, it reflects what each measures. Capability changes slowly, so a monthly or per-release cadence is appropriate for LiveBench and Artificial Analysis. Serving speed changes by the minute as providers shift load, so a ten-minute-to-hourly loop suits TokenDyno. Matching cadence to the underlying signal is part of why these tools complement rather than duplicate each other. For more on reading rankings critically, see the LLM Benchmark Leaderboard guide.
Which should you use for speed vs capability?
For capability, use LiveBench for the cleanest contamination-resistant read, or Artificial Analysis if you also want speed and price in the same view. For speed, use TokenDyno for live, high-frequency tokens-per-second on specific providers, or Artificial Analysis for periodic cross-provider speed snapshots. Most teams combine a capability source with a live-speed source.
A practical workflow looks like this: shortlist models on capability using LiveBench or the Artificial Analysis Intelligence Index, check the rough speed-and-price tradeoff on Artificial Analysis, then validate live serving speed and reliability on your candidate providers with TokenDyno before you commit. No single tool replaces that sequence, which is the core point of comparing them honestly.
Are these tools substitutes or complements?
They are complements, not strict substitutes. LiveBench answers “is the model capable, without contamination,” Artificial Analysis answers “what is the capability-speed-price tradeoff,” and TokenDyno answers “how fast is it serving right now.” Each owns a different question, and using only one leaves a real gap in model selection.
The overlap is partial and useful. Artificial Analysis and TokenDyno both report speed, but at different cadences and granularity, periodic cross-provider snapshots versus a continuous per-endpoint loop that runs every ten minutes to hourly depending on the provider. TokenDyno even displays Artificial Analysis’s Intelligence Index next to its speed data, which is the clearest sign that these tools are designed to be read together. Treat them as a stack, not a contest.
Frequently asked questions
Is LiveBench better than Artificial Analysis?
Neither is strictly better, because they answer different questions. LiveBench gives a focused, contamination-resistant capability score with objective grading. Artificial Analysis aggregates capability, speed, and price in one view. If you only need a clean capability read, LiveBench fits; if you need the full tradeoff, Artificial Analysis fits (Sources: LiveBench, 2026; Artificial Analysis, 2026).
What does TokenDyno measure?
TokenDyno measures live inference speed across providers. It benchmarks models roughly every ten minutes on Ollama Pro and roughly hourly on the capped provider plans, and reports tokens-per-second now, a 24-hour average, time-to-first-token, and 24-hour reliability, sorted by tokens per second. It also displays an Intelligence Index sourced from Artificial Analysis, but it does not run its own capability test (Source: TokenDyno, 2026).
Which should I use for speed vs capability?
For capability, use LiveBench or the Artificial Analysis Intelligence Index. For live speed, use TokenDyno for a continuous per-provider loop that runs every ten minutes to hourly, or Artificial Analysis for periodic cross-provider snapshots. A common pattern is to shortlist on capability, then validate live serving speed and reliability on your candidate providers before shipping (Sources: LiveBench, 2026; TokenDyno, 2026).
Does any tool measure both capability and speed?
Artificial Analysis comes closest, reporting capability, output speed, latency, and price together. LiveBench is capability only, and TokenDyno is speed-focused, though it shows an Artificial Analysis Intelligence Index next to its speed metrics. For live, high-frequency speed on specific endpoints, a dedicated speed tracker still gives more granularity (Source: Artificial Analysis, 2026).
How often does each benchmark update?
LiveBench replaces roughly one-sixth of its questions monthly, for a full refresh about every six months. Artificial Analysis updates capability per model release and measures performance on a recurring schedule. TokenDyno re-benchmarks speed continuously — roughly every ten minutes on Ollama Pro, roughly hourly on Ollama Free and OpenCode Zen, and roughly every half hour on OpenCode Go for its standard-tier models (roughly every six hours for its most expensive models). The cadence matches what each measures (Sources: LiveBench, 2026; Artificial Analysis, 2026; TokenDyno, 2026).
Key takeaways
LiveBench, Artificial Analysis, and TokenDyno are complementary, not competing. LiveBench delivers a contamination-resistant capability score across seven task categories, refreshing about one-sixth of its questions monthly. Artificial Analysis aggregates capability, speed, and price into one comparison, the broadest single view. TokenDyno tracks live tokens-per-second, time-to-first-token, and reliability across specific providers, re-benchmarking every ten minutes to hourly depending on the provider, and reads its capability signal from Artificial Analysis.
Pick by question, not by brand. Need a clean capability read? LiveBench. Need the full capability-speed-price tradeoff? Artificial Analysis. Need to know how fast a provider is serving right now? TokenDyno. The strongest model-selection process uses a capability source and a live-speed source together, then validates on your own candidate endpoints before you commit.
Sources
- LiveBench official site (2026): https://livebench.ai/
- White et al., “LiveBench: A Challenging, Contamination-Free LLM Benchmark,” arXiv:2406.19314 (2024): https://arxiv.org/abs/2406.19314
- Artificial Analysis, AI Model & API Providers Analysis (2026): https://artificialanalysis.ai/
- Artificial Analysis, Intelligence Index (2026): https://artificialanalysis.ai/evaluations/artificial-analysis-intelligence-index
- Artificial Analysis, Benchmarking Methodology (2026): https://artificialanalysis.ai/methodology
- TokenDyno, live multi-provider benchmark (2026): https://tokendyno.com/