Why “LLM Leaderboard” Searches Land on Aggregators (and What’s Missing)
Type “llm leaderboard” into Google and the first page is almost entirely aggregators: Artificial Analysis, Vellum, LLM-Stats, Hugging Face, LMArena, LiveBench, and a few newer composites. None of them are model vendors. That pattern is not an accident, and it tells you something precise about what people want when they run this query and where the gap still sits. This is a market read, not a pitch.
What does the “llm leaderboard” SERP actually look like in 2026?
A live search for “llm leaderboard” returns a top page dominated by independent aggregator sites, not model makers: Artificial Analysis, Vellum, LLM-Stats, the Hugging Face Open LLM Leaderboard, LMArena, LiveBench, and composite trackers such as BenchLM. The keyword draws roughly 8,100 searches per month (Source: internal DataForSEO keyword research, 2026).
I pulled the result set directly rather than reasoning about it from memory. As of 2026-06-28, the organic front page for “llm leaderboard” surfaces Artificial Analysis’s model leaderboard (artificialanalysis.ai/leaderboards/models), Vellum’s leaderboard (vellum.ai/llm-leaderboard), LLM-Stats (llm-stats.com), the Hugging Face Open LLM Leaderboard space (huggingface.co/spaces/open-llm-leaderboard), LMArena’s text arena, LiveBench (livebench.ai), and aggregator newcomers like BenchLM (Source: Google Search, accessed 2026-06-28). The volume figure of 8,100/mo comes from our own DataForSEO keyword pull, not a third-party report, and I label it that way deliberately. For a maintained map of these properties, see LLM Leaderboard 2026.
Why are model vendors almost absent from the results?
Vendors are largely absent because the query is comparative by nature, and a buyer comparing models does not trust a page run by one of the contestants. OpenAI, Anthropic, and Google each publish benchmark numbers, but those land on product or research pages, not on a query whose intent is “rank these against each other.” Search behavior here rewards the perceived neutrality of a third party. The aggregators win the SERP because they sit outside the contest they are scoring, which is exactly the property the searcher is implicitly screening for.
Why do the same handful of aggregators keep ranking?
The same sites recur because “llm leaderboard” is a navigational-leaning query layered on informational intent: many searchers already half-remember a destination (“the one with the speed and price columns”) and are re-finding it. That rewards established, frequently-updated, link-rich domains, and concentrates clicks on a short list.
Search engines read repeat branded navigation, dwell time, and freshness as relevance signals, and a leaderboard that updates as new models ship generates exactly those signals at scale (Source: Google Search Central, “Creating helpful, reliable, people-first content,” 2025, https://developers.google.com/search/docs/fundamentals/creating-helpful-content). Artificial Analysis reinforces this with constant refreshes: it benchmarks performance directly across hundreds of models and versions its scoring publicly, currently shipping an Intelligence Index v4.x with a documented methodology (Source: Artificial Analysis, “Language Model Benchmarking Methodology,” 2026, https://artificialanalysis.ai/methodology). A site that re-earns the click every few weeks is hard to dislodge.
Is this navigational intent or informational intent?
It is both, and the blend is the whole story. Some users want a specific board they have used before (navigational); others want “which model is best right now” with no destination in mind (informational). The aggregators that win serve both at once: a memorable branded home plus a constantly refreshed answer. A page that satisfies only one half of the intent, a static explainer or a one-off ranking, struggles to hold the position. For a side-by-side of how these boards differ in method, see LLM Leaderboards Compared.
What are searchers actually looking for when they type “llm leaderboard”?
Most “llm leaderboard” searchers are not after a single number. They want a current, comparative, decision-ready view, typically some mix of capability, speed, and price, that they can scan in seconds and trust because it was not written by a vendor. The recurring aggregators win precisely because they compress that triad into one scannable table.
You can infer the underlying job from what the top pages emphasize. Artificial Analysis leads with Intelligence, Output Speed (tokens per second), latency (time to first token), context window, and Price, side by side (Source: Artificial Analysis, 2026, https://artificialanalysis.ai/leaderboards/models). LMArena leads with crowd preference, having aggregated more than seven million pairwise votes across hundreds of models (Source: LMArena, 2026, https://lmarena.ai). The split tells you searchers arrive with different jobs, some optimizing for “feels best,” some for “fast and cheap enough to ship,” and the SERP rewards whoever serves that job fastest.
What questions sit behind the keyword?
Behind the single query sit several distinct jobs: “which model is smartest today,” “which is fastest for streaming,” “which is cheapest at acceptable quality,” and “which do other people prefer.” Each maps to a different board, which is why no single leaderboard owns the whole SERP. The capability seekers gravitate to LiveBench and Vellum; the preference seekers to LMArena; the cost-and-speed shippers to Artificial Analysis. The query is one string standing in for four buying questions.
How do the major “llm leaderboard” aggregators compare?
The leading aggregators split cleanly by what they measure: human preference, contamination-limited capability, curated quality, or operational speed and price. None covers all four, and most weight quality over live serving performance. The table below maps what each offers and what it leaves out, drawn from each publisher’s own documentation (accessed 2026-06-28).
| Aggregator | What it offers | What it lacks | Source |
|---|---|---|---|
| Artificial Analysis (artificialanalysis.ai) | Intelligence Index plus output speed (tok/s), latency (TTFT), context window, and price across 100+ models and providers | Speed and latency come from periodic standardized benchmark runs, not continuous live monitoring as provider load shifts | artificialanalysis.ai/methodology |
| Vellum (vellum.ai/llm-leaderboard) | Curated capability table limited to SOTA models released after April 2024, using non-saturated benchmarks | No serving speed (tok/s) or live latency; quality and capability only | vellum.ai/llm-leaderboard |
| LMArena (lmarena.ai) | Human-preference Elo from 7M+ pairwise votes across hundreds of models | Preference only; no objective capability score, speed, or price; lags fresh model launches until vote volume builds | lmarena.ai |
| Hugging Face Open LLM Leaderboard | Automated academic benchmarks (IFEval, BBH, MATH, GPQA, MuSR, MMLU-Pro) for open-weight models | Archived in 2025 and no longer updated; open-weight scope; no speed or price | huggingface.co/spaces/open-llm-leaderboard |
| LiveBench (livebench.ai) | Contamination-limited capability with monthly-refreshed, ground-truth questions and no LLM judge | Capability only; no serving speed, latency, or price | livebench.ai |
| LLM-Stats / BenchLM | Composite quality scores aggregating many third-party benchmarks, some with price and speed columns | Reposts third-party numbers; serving speed is not independently or continuously measured | llm-stats.com |
Which aggregator is closest to a complete picture?
Artificial Analysis is the most complete single board because it is the rare aggregator that puts capability, speed, latency, and price in one view (Source: Artificial Analysis, 2026, https://artificialanalysis.ai). It is the reference point for anyone arguing the gap, because it already proves buyers want operational metrics next to quality. The remaining gap is not “nobody measures speed”, it is how often and how continuously that speed is measured, which the next section takes up.
What’s actually missing from LLM leaderboards?
The consistent gap across the “llm leaderboard” SERP is live, continuously-refreshed serving performance, real tokens per second and cost measured as provider conditions change, rather than as periodic snapshots. Capability boards refresh on benchmark cycles; even speed-aware boards measure in standardized runs, not continuous monitoring.
Two structural facts create the gap. First, quality is comparatively stable, so a board can rerun MMLU-Pro or GPQA on a monthly cadence and stay roughly accurate. Serving speed is not stable: tokens per second on the same model varies with provider, region, time of day, concurrency, and quantization, so a number measured last week may not describe what you get this afternoon. Artificial Analysis defines output speed rigorously, tokens per second after the first chunk, using server-side token counts verified against the model’s native tokenizer (Source: Artificial Analysis, “Methodology,” 2026, https://artificialanalysis.ai/methodology), but a standardized periodic run is, by design, a snapshot. The argument for treating speed as a first-class, continuously-tracked metric is laid out in Why Tokens/sec Belongs in Every LLM Ranking.
Why does live speed data update slower than quality scores would suggest?
Counterintuitively, the metric that changes fastest is tracked least often. Quality scores feel like they should age quickly because new models ship constantly, but a given model’s quality is fixed once released. Its serving speed is the volatile variable, yet most boards capture it in occasional benchmark passes. The result is a SERP full of fresh-looking quality rankings sitting next to speed figures that may be the oldest data on the page.
Who is positioned to fill the gap?
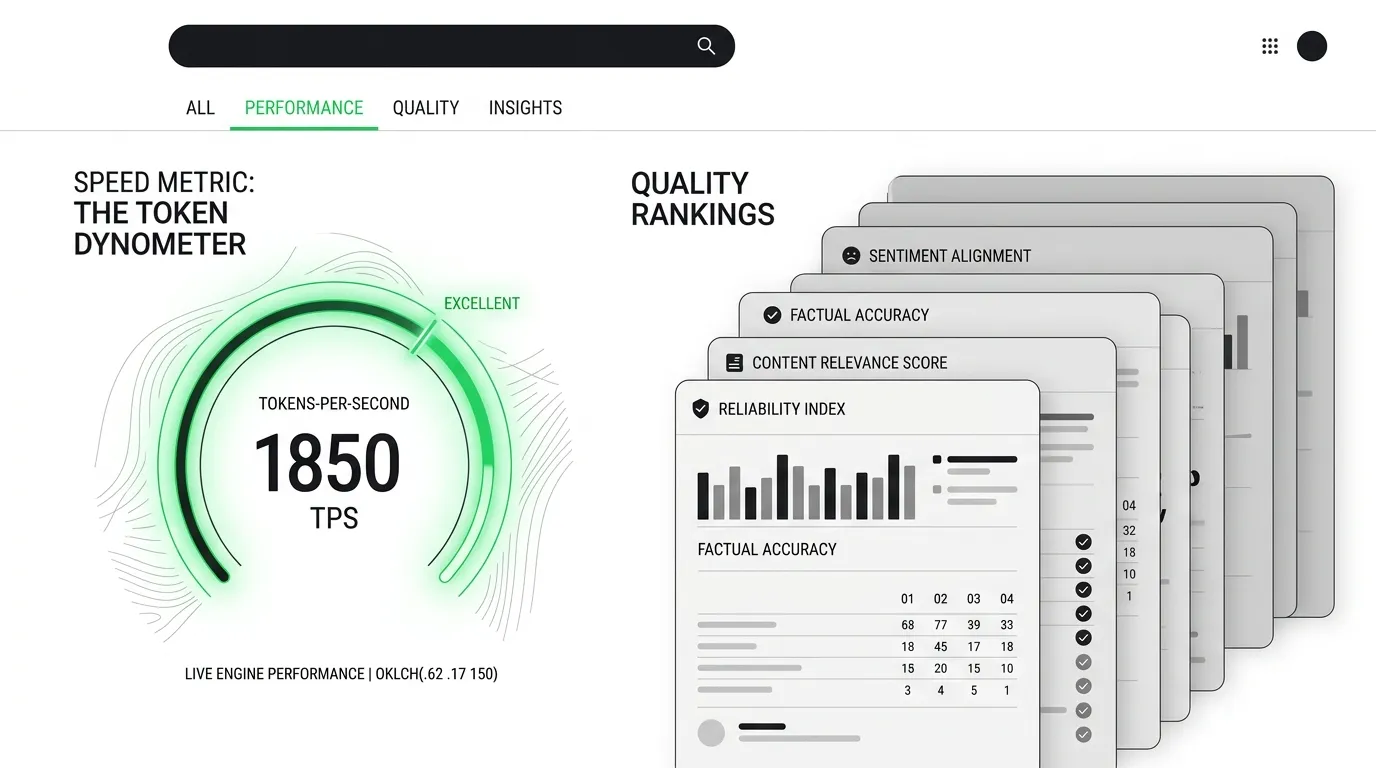
The opening is for whoever measures serving speed and cost continuously, the way uptime and latency monitors already work for web infrastructure, and exposes it in the same scannable form the winning aggregators use. This is the lane a live tokens-per-second dyno like TokenDyno occupies: not another quality board, but the continuously-updated speed-and-cost layer that the established leaderboards under-serve. The market has already shown, through Artificial Analysis’s success, that buyers want operational metrics beside quality. The unmet half is making the most volatile of those metrics genuinely live.
What does this mean for how you read leaderboards?
Treat the “llm leaderboard” SERP as a set of specialized instruments, not interchangeable rankings. Use a preference board for “feels best,” a capability board for “is it actually correct,” and a speed-and-price board for “can I afford to ship it”, and assume the speed figures may be the stalest data on any quality-first page.
The practical move is to cross-read: confirm a model’s capability on LiveBench or Vellum, sanity-check preference on LMArena, then verify operational speed and cost against whatever source measures them most recently. No single board is wrong; each is answering a different question, and the searcher’s job is to know which question they are actually asking. The aggregators dominate the SERP because they answer fast and update often. The lasting gap is making the fastest-changing metric the freshest one on the page.
Frequently asked questions
What is the most popular LLM leaderboard?
By search visibility and citation, Artificial Analysis is the most prominent, because it ranks 100+ models on intelligence, speed, latency, and price in one view (Source: Artificial Analysis, 2026, https://artificialanalysis.ai). LMArena is the most-cited for human preference, with 7M+ votes (Source: LMArena, 2026, https://lmarena.ai). “Most popular” depends on whether you want preference, capability, or operational data.
Why do the same sites rank for “llm leaderboard”?
The query blends navigational and informational intent: people re-find a board they trust while also wanting “the best model now.” That rewards established domains that refresh constantly as new models ship, concentrating clicks on a short list of aggregators (Source: Google Search Central, 2025, https://developers.google.com/search/docs/fundamentals/creating-helpful-content). Freshness plus perceived neutrality keeps the same handful on page one.
What’s missing from LLM leaderboards?
The gap is live, continuously-measured serving performance. Capability boards refresh on benchmark cycles, and even speed-aware boards like Artificial Analysis measure in periodic standardized runs (Source: Artificial Analysis, 2026, https://artificialanalysis.ai/methodology). Real tokens-per-second and cost shift with provider load and region, so a snapshot can be the oldest data on an otherwise fresh page.
Are vendor leaderboards trustworthy?
Vendor-published benchmarks can be accurate but are rarely neutral, since the publisher is a contestant. That is why “llm leaderboard” searches land on independent aggregators rather than model makers. Use vendor numbers as a starting claim, then verify capability and speed against third-party boards that measure all models on the same standardized harness.
How often should I re-check a leaderboard?
Re-check capability when a model you use ships a new version, since quality is fixed at release. Re-check serving speed and cost far more often, weekly or before any latency-sensitive deployment, because tokens-per-second varies with provider, region, and load in ways a monthly benchmark pass will not capture.
Sources
- Google Search, organic results for “llm leaderboard,” accessed 2026-06-28.
- Artificial Analysis, “LLM Leaderboard,” 2026. https://artificialanalysis.ai/leaderboards/models
- Artificial Analysis, “Language Model Benchmarking Methodology,” 2026. https://artificialanalysis.ai/methodology
- Vellum, “LLM Leaderboard 2026,” 2026. https://www.vellum.ai/llm-leaderboard
- LMArena, leaderboard and vote totals, 2026. https://lmarena.ai
- Hugging Face, “Open LLM Leaderboard” (archived), 2025. https://huggingface.co/spaces/open-llm-leaderboard/open_llm_leaderboard
- LiveBench, methodology and tasks, 2026. https://livebench.ai
- LLM-Stats, “LLM Leaderboard 2026,” 2026. https://llm-stats.com
- Google Search Central, “Creating helpful, reliable, people-first content,” 2025. https://developers.google.com/search/docs/fundamentals/creating-helpful-content
- Internal DataForSEO keyword research (search volume 8,100/mo), 2026.