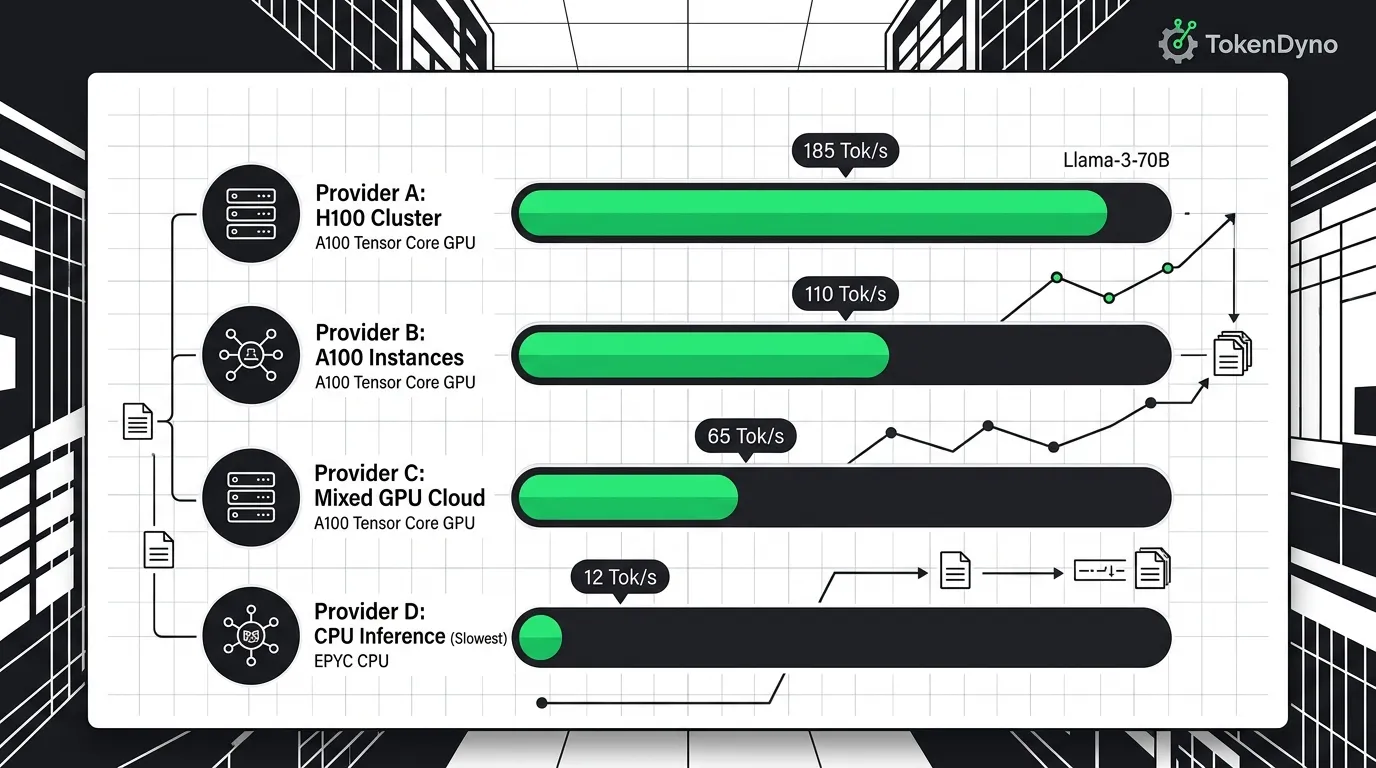
LLM Speed Comparison: Throughput Across Models and Providers
An LLM speed comparison is only meaningful when you fix the model and the provider, because the same model runs at wildly different speeds depending on who hosts it. On Artificial Analysis live data, gpt-oss-120B runs at 1,753 output tokens/sec on Cerebras but 51.7 on DeepInfra, a 33.9x gap on identical weights (Source: Artificial Analysis, 2026).
That single fact reframes the whole question. People ask “how fast is this model?” when the honest answer is “how fast is this model, on this hardware, served by this provider, right now?” Throughput is a property of the serving stack as much as the model. This post compares real, sourced output-tokens-per-second figures across models and providers, shows how large the provider gap actually is, and gives you a fair way to compare before you commit. Every number below is from a named 2025-2026 source, and all of them move frequently.
What is an LLM speed comparison?
An LLM speed comparison ranks models by how fast they generate text, usually in output tokens per second. But the metric belongs to the serving setup, not the model alone: Artificial Analysis tracks 16 providers on Llama 3.3 70B, where speed varies 152% between fastest and slowest (Source: Artificial Analysis, 2026).
Output tokens per second is the headline number, the rate at which a model streams text once it starts responding. A second metric, time-to-first-token, captures the wait before output begins. Most “speed” rankings sort by output tokens per second because it dominates how fast a long answer completes. For a primer on the unit itself, see LLM tokens per second. The key idea: a fair comparison holds the model constant and varies the provider, or holds the provider constant and varies the model. Mixing both at once produces numbers that look authoritative but mean little.
What does “speed” actually measure?
Speed has two components people routinely conflate. Output tokens per second measures generation throughput after the first token arrives. Time-to-first-token measures latency before it does. A chat interface feels fast with low time-to-first-token; a document summarizer or code generator feels fast with high output tokens per second. On Llama 3.3 70B, Google Vertex posts the lowest time-to-first-token at 0.71 seconds while Groq leads output speed at 322 tokens/sec (Source: Artificial Analysis, 2026). The “fastest” provider can differ depending on which of the two you weight, so name your metric before you rank.
Why does the same model run at different speeds on different providers?
The same model runs at different speeds because throughput is set by hardware, quantization, and batching, not by the model weights alone. On gpt-oss-120B, Cerebras serves 1,753 tokens/sec versus DeepInfra’s 51.7, while on Llama 3.3 70B, Groq’s 322 tokens/sec is 21.7x the slowest endpoint’s 14.8 (Source: Artificial Analysis, 2026).
This is the most important and most misunderstood fact in inference benchmarking. “Model speed” is really provider-plus-hardware speed. The exact same weights, with the same name on the API, generate tokens at vastly different rates depending on the chip they run on, the numerical precision the provider chose, and how many other requests share the hardware. The table below shows the spread directly: one model, many hosts, very different throughput.
Same model, different provider: the speed spread
| Model | Provider | Output tokens/sec | Source |
|---|---|---|---|
| gpt-oss-120B | Cerebras | 1,753.0 | Artificial Analysis, 2026 |
| gpt-oss-120B | SambaNova | 692.7 | Artificial Analysis, 2026 |
| gpt-oss-120B | Fireworks | 690.1 | Artificial Analysis, 2026 |
| gpt-oss-120B | Together AI | 563.5 | Artificial Analysis, 2026 |
| gpt-oss-120B | Groq | 477.6 | Artificial Analysis, 2026 |
| gpt-oss-120B | DeepInfra | 51.7 | Artificial Analysis, 2026 |
| Llama 3.3 70B | Groq | 322.0 | Artificial Analysis, 2026 |
| Llama 3.3 70B | Makora (FP8) | 285.6 | Artificial Analysis, 2026 |
| Llama 3.3 70B | SambaNova | 282.3 | Artificial Analysis, 2026 |
| Llama 3.3 70B | Google Vertex | 130.4 | Artificial Analysis, 2026 |
| Llama 3.3 70B | DeepInfra (Turbo, FP8) | 14.8 | Artificial Analysis, 2026 |
Read the gpt-oss-120B rows top to bottom: identical weights, a 33.9x range from Cerebras to DeepInfra. The Llama 3.3 70B rows tell the same story with a 21.7x range. If you benchmark a model on one provider and assume the number transfers, you can be off by more than an order of magnitude.
What drives the provider gap?
Three forces explain most of the spread. Hardware: wafer-scale and ASIC chips (Cerebras, Groq, SambaNova) hold weights in fast on-chip SRAM, while GPU clouds page weights from slower high-bandwidth memory, so per-user generation runs faster on the specialized chips (Source: Artificial Analysis, 2026). Quantization: providers serving FP8 or FP4 variants generate faster than full-precision endpoints, which is why labels like “Turbo, FP8” appear next to the model name. Batching and load: per-user speed drops as a provider packs more concurrent requests onto the same silicon. All three vary by provider and by hour, which is why a one-time benchmark expires quickly.
Which LLM is fastest across models and providers?
There is no single fastest LLM; the leader rotates by model. On Artificial Analysis live data, Cerebras tops gpt-oss-120B at 1,753 tokens/sec while Groq tops Llama 3.3 70B at 322, and on the overall leaderboard small specialized models like Mercury 2 reach 805.7 tokens/sec (Source: Artificial Analysis, 2026).
Because the answer changes by model, a fair “fastest” ranking has to name both the model and the host. The leaderboard below pairs each model with its current speed leader from live provider data. It is a starting point, not a verdict: the entries shift as providers re-optimize, and a vendor that leads one model may not even serve another at scale. For the full live ranking and hardware breakdown, see fastest LLM inference in 2026.
Speed leaders by model (live provider data, 2026)
| Model | Fastest live provider | Output tokens/sec | Source |
|---|---|---|---|
| gpt-oss-120B | Cerebras | 1,753.0 | Artificial Analysis, 2026 |
| Llama 3.3 70B | Groq | 322.0 | Artificial Analysis, 2026 |
| DeepSeek V4 Flash (Max) | Makora | 291.3 | Artificial Analysis, 2026 |
| DeepSeek V4 Flash (High) | Makora | 249.1 | Artificial Analysis, 2026 |
| Gemini 2.5 Flash | ~200 | Artificial Analysis, 2026 |
Does the fastest provider change by model?
Yes, and that is the rule rather than the exception. Cerebras leads gpt-oss-120B but does not appear at the top of Llama 3.3 70B, where Groq leads; Makora tops both DeepSeek V4 Flash tiers but is mid-pack on Llama 3.3 70B at 285.6 tokens/sec (Source: Artificial Analysis, 2026). Availability and per-model optimization differ across providers. A vendor may serve one model on its fastest hardware, another on commodity GPUs, and a third not at all. So pick your model first on quality grounds, then rank only the providers that actually serve it.
How do speeds compare for DeepSeek, Llama, and frontier models?
The provider gap holds across model families. On DeepSeek V4 Flash (Max), Makora serves 291.3 tokens/sec versus DeepSeek’s own 123.6 and GMI’s 111.0, a 184% spread on one model; the V4 Flash (High) tier shows a similar 183% spread (Source: Artificial Analysis, 2026).
DeepSeek is a clean example because its first-party API and many third-party hosts run the same released weights. Makora leads both Flash tiers while DeepSeek’s own endpoint trails on raw speed but often wins on price, a reminder that speed and cost are separate axes. The table below captures the DeepSeek V4 Flash provider spread alongside the Llama and frontier reference points, so you can see how far apart hosts of one model can sit.
Provider spread within one model family
| Model | Provider | Output tokens/sec | Source |
|---|---|---|---|
| DeepSeek V4 Flash (Max) | Makora | 291.3 | Artificial Analysis, 2026 |
| DeepSeek V4 Flash (Max) | DeepSeek | 123.6 | Artificial Analysis, 2026 |
| DeepSeek V4 Flash (Max) | GMI | 111.0 | Artificial Analysis, 2026 |
| DeepSeek V4 Flash (High) | Makora | 249.1 | Artificial Analysis, 2026 |
| DeepSeek V4 Flash (High) | GMI | 104.0 | Artificial Analysis, 2026 |
| DeepSeek V4 Flash (High) | Novita | 99.9 | Artificial Analysis, 2026 |
For frontier flagships the picture inverts: throughput is often capped by reasoning, not hardware. Artificial Analysis reports Gemini 3.1 Pro with higher output throughput than Claude Opus 4.7 or GPT-5.5 in its highest reasoning (“xhigh”) mode, where GPT-5.5 also carries the longest time-to-first-token (Source: Artificial Analysis, 2026). Gemini 2.5 Flash, a lighter model, streams around 200 tokens/sec (Source: Artificial Analysis, 2026).
Why are reasoning models slower?
Reasoning models spend tokens thinking before they answer, so wall-clock speed falls even when per-token generation is fast. DeepSeek’s V4 Pro reasoning tier at maximum effort generates about 79.7 output tokens/sec, well below the 152 tokens/sec of the non-reasoning V4 Flash (Max) on the same API (Source: Artificial Analysis, 2026). The trade-off is deliberate: heavier reasoning raises answer quality and lowers raw throughput. There is also a token-efficiency angle that pure tokens-per-second misses. Artificial Analysis notes GPT-5.5 (xhigh) uses roughly 40% fewer output tokens to complete its benchmark suite than its predecessor, so it can finish a task sooner in wall-clock terms even without the highest per-token rate (Source: Artificial Analysis, 2026).
How do peak records compare to live speed?
Peak records sit far above live medians because they measure single-stream, latency-optimized configurations rather than production endpoints. Cerebras reported Llama 4 Maverick at 2,522 tokens/sec, Artificial Analysis-verified, against NVIDIA Blackwell’s 1,038 on the same model, and Groq pushed Llama 3.3 70B to 1,665 tokens/sec with speculative decoding (Source: Cerebras, 2025; Groq, 2025).
These figures are real but answer a different question than the live tables above. A record is the best speed achievable under ideal, single-user conditions; a live median is what an ordinary API key sustains under real load. Keep them in separate columns and never compare a record against a live number.
Peak record claims (2025), still cited in 2026
| Model | Hardware / Provider | Peak output tokens/sec | Source |
|---|---|---|---|
| Llama 4 Maverick | Cerebras WSE-3 | 2,522 | Cerebras, 2025 |
| Llama 4 Maverick | NVIDIA Blackwell (AA-measured) | 1,038 | Cerebras / Artificial Analysis, 2025 |
| Llama 4 Maverick | NVIDIA DGX B200 (8 GPU) | >1,000 per user; 72,000 per server | NVIDIA, 2025 |
| gpt-oss-120B | Cerebras | 3,000 | Cerebras, 2025 |
| Llama 3.3 70B (speculative decoding) | Groq LPU | 1,665 | Groq, 2025 |
| Llama 3.1 70B | Cerebras | 450+ | Cerebras, 2025 |
| Llama 3.1 8B | Cerebras | 1,800+ | Cerebras, 2025 |
Why records overstate real-world speed
The gap between record and reality is mostly batching. NVIDIA states the DGX B200 figure plainly: over 1,000 tokens/sec per user used FP8, EAGLE3 speculative decoding, and custom CUDA kernels, and is distinct from the 72,000 tokens/sec aggregate a full server delivers across many simultaneous users (Source: NVIDIA, 2025). Per-user peak and aggregate throughput are different products. Groq’s jump from roughly 250 to 1,665 tokens/sec on Llama 3.3 70B came from a software speculative-decoding endpoint with no quality degradation in independent evaluation (Source: Groq, 2025), but that endpoint is a specific configuration, not the default every key receives.
How do you compare LLM speed fairly?
Compare fairly by fixing four variables: the exact model, the precision, the provider, and the metric. On Llama 3.3 70B alone, output speed ranges from 322 tokens/sec on Groq to 14.8 on a DeepInfra FP8 endpoint, so an unlabeled “Llama 3.3 70B speed” number is close to meaningless (Source: Artificial Analysis, 2026).
A short discipline prevents most bad comparisons. First, name the model and its precision; “Llama 3.3 70B” and “Llama 3.3 70B FP8” are different products. Second, name the provider and the endpoint variant, since “Turbo” and standard endpoints differ. Third, pick the metric that matches your workload: output tokens per second for long generations, time-to-first-token for interactive chat. Fourth, use the same measurement methodology for every contender. Independent streaming tests show Fireworks and Together within a few tokens/sec of each other on the same model, with the real difference in time-to-first-token, a gap you only see if you measure both metrics (Source: DeployBase, 2026).
A fair-comparison checklist
Before you trust any speed table, confirm five things. (1) Is the model identical, including version and parameter count? (2) Is the precision labeled and matched across rows? (3) Is each row a live production endpoint, not a one-time record? (4) Is the metric the same for every row, output speed or time-to-first-token, not a mix? (5) Is the data fresh, with a visible date? For throughput-specific methodology, see LLM throughput benchmark. If any answer is no, treat the comparison as directional, not decisive.
Why do speed rankings change so often?
Rankings change because every input moves: providers add endpoints, switch precision, re-optimize software, and absorb shifting load. Artificial Analysis publishes medians over a rolling 72-hour window sampled several times daily, so the same model shows different numbers across snapshots taken days apart (Source: Artificial Analysis, 2026).
Treat any published speed figure, including the ones in this post, as a snapshot rather than a constant. Groq’s overnight 6x gain on Llama 3.3 70B from a software update is the clearest illustration: a single optimization reshaped the leaderboard (Source: Groq, 2025). The practical takeaway is to verify against a live source right before you decide, then re-check periodically after launch. TokenDyno tracks these output-tokens-per-second figures live across providers; see the current standings at TokenDyno. The numbers in the tables above were accurate at the dates cited and will drift.
Frequently asked questions
Which LLM is fastest?
There is no single fastest LLM; it depends on the model and provider. On Artificial Analysis live data, Cerebras serves gpt-oss-120B at 1,753 output tokens/sec, the fastest sustained mainstream figure, while small specialized models like Mercury 2 reach 805.7 tokens/sec (Source: Artificial Analysis, 2026). Rankings change daily, so verify against a live source.
Why does the same model run at different speeds?
Because throughput comes from hardware, precision, and batching, not weights alone. The identical gpt-oss-120B model runs at 1,753 tokens/sec on Cerebras and 51.7 on DeepInfra, a 33.9x gap (Source: Artificial Analysis, 2026). Specialized inference chips, FP8 quantization, and lighter concurrent load all push the same model faster on one provider than another.
How do I compare LLM speed fairly?
Fix four variables: the exact model, the precision, the provider, and the metric. Output speed on Llama 3.3 70B ranges from 322 to 14.8 tokens/sec across providers, so an unlabeled number is meaningless (Source: Artificial Analysis, 2026). Match output tokens/sec to long generations and time-to-first-token to interactive chat, and use one methodology for all contenders.
What is the difference between output speed and time to first token?
Output speed measures how fast tokens stream after generation starts; time-to-first-token measures the wait before it begins. On Llama 3.3 70B, Google Vertex leads time-to-first-token at 0.71 seconds while Groq leads output speed at 322 tokens/sec (Source: Artificial Analysis, 2026). Chat apps weight latency; long-form generation weights output speed.
Are peak benchmark numbers the same as real-world speed?
No. Peaks measure single-stream, latency-optimized runs; live medians measure shared production endpoints. NVIDIA’s Blackwell hit over 1,000 tokens/sec per user on Llama 4 Maverick using FP8 and speculative decoding, distinct from its 72,000 tokens/sec aggregate across many users (Source: NVIDIA, 2025). Never compare a record against a live API figure.
How often do LLM speed rankings change?
Frequently, sometimes within days. Artificial Analysis uses a rolling 72-hour measurement window, and providers continuously add, remove, and re-optimize endpoints (Source: Artificial Analysis, 2026). Groq once gained 6x on Llama 3.3 70B from a software update alone (Source: Groq, 2025). Treat any figure as a snapshot and re-verify before relying on it.
Sources
- Artificial Analysis, gpt-oss-120B providers: https://artificialanalysis.ai/models/gpt-oss-120b/providers
- Artificial Analysis, Llama 3.3 70B providers: https://artificialanalysis.ai/models/llama-3-3-instruct-70b/providers
- Artificial Analysis, DeepSeek V4 Flash (Max) providers: https://artificialanalysis.ai/models/deepseek-v4-flash/providers
- Artificial Analysis, DeepSeek V4 Flash (High) providers: https://artificialanalysis.ai/models/deepseek-v4-flash-high/providers
- Artificial Analysis, DeepSeek provider analysis: https://artificialanalysis.ai/providers/deepseek
- Artificial Analysis, model leaderboard: https://artificialanalysis.ai/leaderboards/models
- Artificial Analysis, GPT-5.5 is the new leading AI model: https://artificialanalysis.ai/articles/openai-gpt5-5-is-the-new-leading-AI-model
- Cerebras, Llama 4 Maverick world-record press release: https://www.cerebras.ai/press-release/maverick
- Cerebras, gpt-oss-120B at 3,000 tokens/sec: https://www.cerebras.ai/blog/cerebras-launches-openai-s-gpt-oss-120b-at-a-blistering-3-000-tokens-sec
- Cerebras, inference 3x faster (Llama 3.1 70B): https://www.cerebras.ai/blog/cerebras-inference-3x-faster
- Groq, Llama 3.3 70B speed benchmark: https://groq.com/blog/new-ai-inference-speed-benchmark-for-llama-3-3-70b-powered-by-groq
- Groq, speculative decoding 6x speed boost on Llama 3.3 70B: https://groq.com/blog/groq-first-generation-14nm-chip-just-got-a-6x-speed-boost-introducing-llama-3-1-70b-speculative-decoding-on-groqcloud
- NVIDIA, Blackwell breaks 1,000 TPS/user with Llama 4 Maverick: https://developer.nvidia.com/blog/blackwell-breaks-the-1000-tps-user-barrier-with-metas-llama-4-maverick/
- DeployBase, Fireworks vs Together vs DeepInfra speed and quality: https://deploybase.ai/articles/fireworks-vs-together-vs-deepinfra-pricing-speed-and