LLM Tokens Per Second: How to Measure Inference Speed
Tokens per second (tokens/sec, or TPS) is the standard way to measure how fast a large language model generates text. It counts the output tokens a model emits each second during decoding. But the number depends on the phase you measure, the tokenizer the model uses, batch size, and the hardware — so a single headline figure rarely means what people think. This guide shows how to measure it correctly.
Key takeaways
- Tokens/sec usually refers to output speed: tokens emitted per second after the first token arrives (Source: Artificial Analysis, 2026).
- Inference has two phases — prefill and decode — with very different speed profiles (Source: NVIDIA, 2024).
- Raw tokens/sec is not directly comparable across models because tokenizers differ (Source: Baseten; Meta, 2024).
- The same model is served at wildly different speeds: Llama 3.3 70B ran at 322 t/s on the fastest provider versus 14.8 t/s on the slowest — a 21.7x gap (Source: Artificial Analysis, 2026).
For the broader context on how speed fits into model evaluation, see What Is an LLM Benchmark?.
What is “tokens per second” in LLM inference?
Tokens per second measures generation throughput: how many tokens a model produces in one second. Artificial Analysis defines output speed precisely as “the average number of tokens received per second, after first token received” (Source: Artificial Analysis, 2026). That qualifier matters — it excludes the initial wait, so tokens/sec describes sustained generation rate, not the full end-to-end response time a user feels.
A “token” is a chunk of text — often a word fragment — produced by the model’s tokenizer. Because models report their own tokens, the unit is model-specific, a point we return to below. When you see a model advertised at “150 tokens/sec,” that is almost always the output decode rate measured during streaming generation, not input processing.
Output tokens/sec vs input tokens/sec
Output tokens/sec is what most benchmarks report, but input throughput is a separate, usually much higher, number. During the prefill phase the model ingests your entire prompt at once, so input tokens are processed in parallel and the effective input rate can be many times the output rate. Output tokens, by contrast, are generated sequentially — one at a time — which is why decode is the bottleneck for interactive use. When comparing tools, confirm which direction the figure describes; mixing the two inflates results by an order of magnitude.
Prefill vs decode: the two phases that set your speed
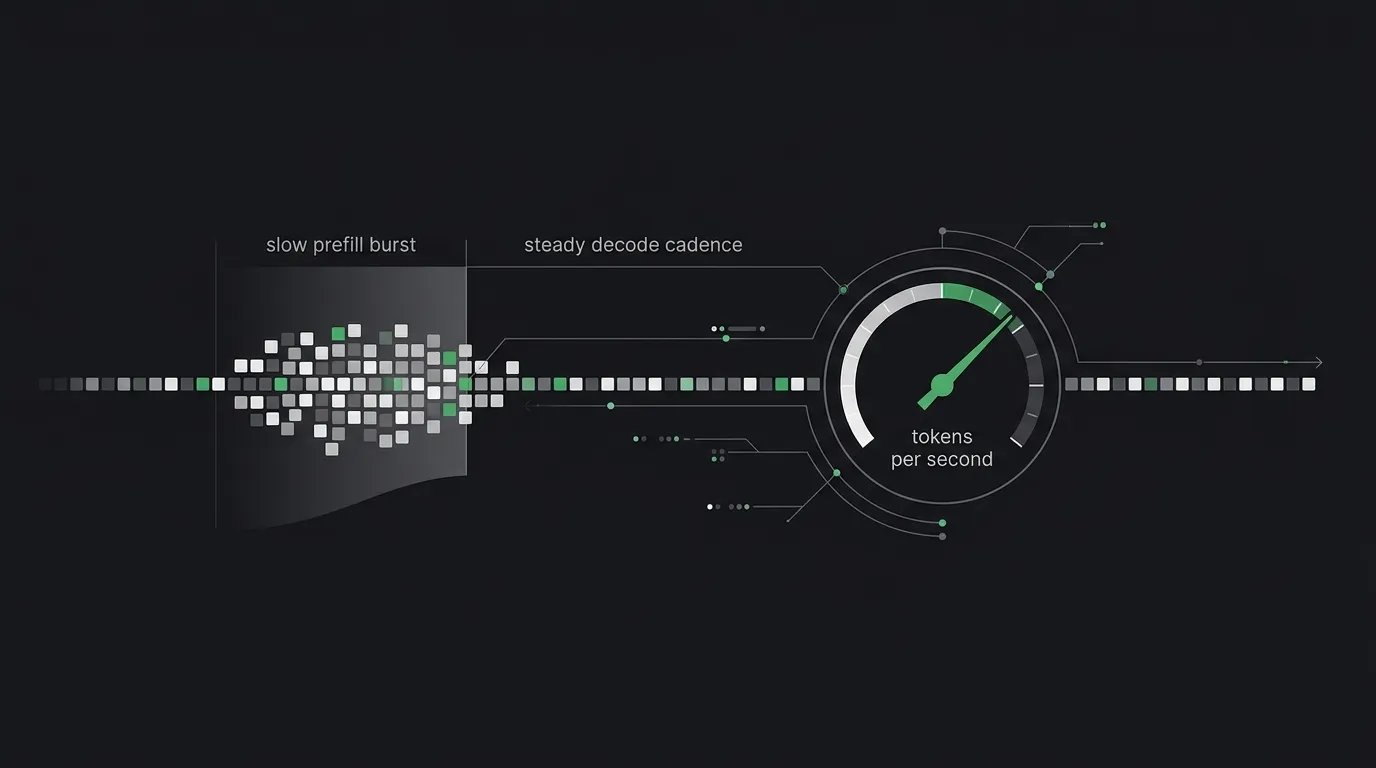
LLM inference runs in two phases with opposite performance characteristics. Prefill processes all input tokens to build the KV cache and produce the first output token; it is compute-bound and uses the GPU’s parallel compute heavily. Decode then generates output tokens one at a time, updating state from prefill, and is memory-bandwidth-bound (Source: NVIDIA, 2024). Tokens/sec almost always describes the decode phase.
This split explains why a long prompt slows your first token but barely changes the per-token rate afterward. Prefill cost scales with input length; decode cost scales with output length. If you measure “speed” without separating the two, a model that reads a 10,000-token document will look slower than the same model on a one-line prompt, even though its decode rate is identical. Always measure prefill and decode separately.
Time-to-first-token (TTFT)
Time-to-first-token is the delay before the model emits its first output token. Artificial Analysis defines TTFT as the time in seconds between sending a request and receiving the first token of the response (Source: Artificial Analysis, 2026). TTFT is dominated by prefill, so it grows with prompt length: the more input the model must read before it can answer, the longer the wait. For chat and agents, TTFT shapes perceived responsiveness more than raw tokens/sec, because it is the silence the user notices first.
Inter-token latency (ITL)
Inter-token latency — also called time-per-output-token (TPOT) — is the average gap between consecutive output tokens during decode. It is the inverse of output tokens/sec: a model running at 100 tokens/sec has roughly 10 ms inter-token latency. ITL is set by the memory-bound decode phase, so it is comparatively stable across prompt lengths but degrades as you pack more concurrent requests onto the same hardware. Note that Artificial Analysis reports “output speed” rather than an explicit ITL figure; the two are reciprocal views of the same decode rate.
Why tokens/sec isn’t directly comparable across models
Tokens/sec is not directly comparable across models because each model uses a different tokenizer, so a “token” represents a different amount of text. Baseten makes this explicit: because models use different tokenizers, a raw tokens/sec count measures that model’s tokens, not a fixed unit of readable text, so you must normalize before comparing (Source: Baseten, 2024). A model with a more efficient tokenizer produces fewer tokens for the same output — and can look slower while actually being faster in words.
Meta’s own numbers illustrate the gap: the Llama 3 tokenizer is up to 15% more efficient than Llama 2’s, meaning roughly 85 Llama 3 tokens encode the same text as 100 Llama 2 tokens (Source: Meta, via Baseten, 2024). The effect is also content-dependent — tokenizers differ more on code than on prose.
Tokens per word varies by language and content
Researchers quantify this with “fertility,” the average number of tokens per word. The Llama-3.1 tokenizer has a fertility of 1.33 for English versus 2.73 for Greek — more than double (Source: Krikri / arXiv 2505.13772, 2025). So the same model generating at a fixed tokens/sec rate delivers far fewer words per second in Greek than in English. The practical rule: to compare models fairly, convert tokens/sec to words/sec or characters/sec, or hold the tokenizer constant. Otherwise you are comparing different units that happen to share a name.
How batch size changes throughput vs latency
Batch size is the main lever in the throughput-versus-latency tradeoff. Serving more requests together raises aggregate tokens/sec but can raise per-request latency. Anyscale measured up to a 23x throughput improvement from continuous batching plus memory optimization over naive static batching, tested on a single A100 40GB with OPT-13B (Source: Anyscale, 2023). The system processes far more total tokens — but each individual user may wait slightly longer for their turn through the decode loop.
NVIDIA describes the same tension directly: in-flight batching processes prefill and decode together for efficiency, but “can introduce latency as the decode phases are delayed until the prefill requests are completed” (Source: NVIDIA, 2024). This is why a provider’s aggregate throughput (total tokens/sec across all users) and your single-stream tokens/sec are different metrics. When you benchmark, fix the concurrency level and report it — a tokens/sec figure without a stated batch size or concurrency is not reproducible.
A worked example: real published tokens/sec numbers
Here is what verified 2026 data looks like for one model, Llama 3.3 70B, served by different providers. On the live Artificial Analysis provider table, Groq runs it at 322.0 tokens/sec — the fastest — which is 21.7x faster than the slowest measured provider, DeepInfra (Turbo, FP8), at 14.8 tokens/sec (Source: Artificial Analysis, 2026). Same weights, same model, a 21.7x speed gap purely from serving stack and hardware.
A snapshot of the same model across providers:
| Provider | Output tokens/sec | Source |
|---|---|---|
| Groq | 322.0 | Artificial Analysis, 2026 |
| Makora (FP8) | 285.6 | Artificial Analysis, 2026 |
| SambaNova | 282.3 | Artificial Analysis, 2026 |
| Google Vertex | 130.4 | Artificial Analysis, 2026 |
| DeepInfra (Turbo, FP8) | 14.8 | Artificial Analysis, 2026 |
Specialized hardware widens the range further. Cerebras reported its wafer-scale system serving Llama 3.1 8B at over 1,800 tokens/sec and Llama 3.1 70B at over 450 tokens/sec, citing Artificial Analysis measurements (Source: Cerebras, 2024). Groq separately published 276 tokens/sec for Llama 3.3 70B at launch (Source: Groq, 2024) — close to, but not identical to, the live 322 t/s above, which shows why you should always cite the measurement date. Throughput numbers age; treat any single figure as a timestamped reading, not a constant. For the current ranking, see Fastest LLM Inference in 2026.
What is a good tokens-per-second speed?
A “good” tokens/sec speed is one that comfortably outpaces human reading. The most rigorous estimate of silent reading rate is about 238 words per minute for non-fiction, from a meta-analysis of studies spanning 1901–2019 with roughly 18,573 participants (Source: Brysbaert, 2019). The commonly quoted “300 wpm” overstates it.
Converting that to tokens (our arithmetic, not a sourced constant): using OpenAI’s rule of thumb of roughly 0.75 words per token, 238 wpm is about 5 tokens/sec. So any model generating above ~5–6 tokens/sec already exceeds average reading pace. Interactive products aim higher — tens to hundreds of tokens/sec — so output never feels like it is stalling, and so agents that consume their own output (not a human) finish faster. Above reading pace, additional tokens/sec mainly helps automated pipelines and long generations, not human comprehension.
How to benchmark tokens per second yourself
To measure tokens/sec reliably, separate the phases and fix every variable. Send a request, record the timestamp of the first streamed token (TTFT), then time the remaining tokens and divide the output token count by that interval to get decode tokens/sec. Count tokens with the model’s own tokenizer, not a word count, so your unit matches the model’s. Repeat across many requests and report the median, as Artificial Analysis does with its P50 over a 72-hour window (Source: Artificial Analysis, 2026).
A reproducible benchmark checklist
- Fix the prompt and output length. Use a set input length and a
max_tokenscap so prefill and decode cost are constant across runs. - Stream the response. You cannot measure TTFT or per-token timing without token-level streaming.
- State concurrency and batch size. A tokens/sec number is meaningless without the load it was measured under.
- Report TTFT and tokens/sec separately. They answer different questions — responsiveness versus sustained speed.
- Record the date, provider, region, and model version. Throughput drifts; a result is only reproducible with its context.
- Use the median, not the mean. Tail latencies skew averages; the median reflects typical experience.
For deeper measurement of the responsiveness side, see LLM Latency Benchmark. TokenDyno publishes live tokens/sec readings using this methodology so the figures stay current rather than frozen at one launch-day number.
Frequently asked questions
What is a good tokens-per-second speed?
Anything above about 5–6 tokens/sec exceeds average human reading pace, since silent reading averages roughly 238 words per minute (Source: Brysbaert, 2019). For interactive chat, providers target tens to hundreds of tokens/sec for snappy output. Specialized hardware reaches far higher — over 1,800 tokens/sec for an 8B model (Source: Cerebras, 2024).
How is tokens per second measured?
You time the model’s streamed output: record time-to-first-token, then divide the number of output tokens by the time taken to generate them, counting tokens with the model’s own tokenizer. Report the median across many runs at a fixed concurrency. Artificial Analysis defines output speed as tokens received per second after the first token (Source: Artificial Analysis, 2026).
What’s the difference between tokens/sec and latency?
Tokens/sec is a throughput rate — how fast output streams during decode. Latency is a delay: time-to-first-token (TTFT) is the wait before output begins, dominated by prefill (Source: NVIDIA, 2024). A model can have low TTFT but slow tokens/sec, or vice versa, so both are needed to describe real-world speed.
Why can’t I compare tokens/sec across different models?
Because each model uses a different tokenizer, so a token represents a different amount of text (Source: Baseten, 2024). The Llama 3 tokenizer is up to 15% more efficient than Llama 2’s (Source: Meta, 2024), and tokens-per-word varies by language — 1.33 for English versus 2.73 for Greek on Llama 3.1 (Source: arXiv 2505.13772, 2025). Convert to words/sec to compare fairly.
Does batch size affect tokens per second?
Yes. Larger batches raise aggregate throughput substantially — up to 23x from continuous batching in one test (Source: Anyscale, 2023) — but can increase per-request latency because decode steps are delayed behind prefill (Source: NVIDIA, 2024). Always report the concurrency level a tokens/sec figure was measured at.
Is input or output tokens/sec faster?
Input processing (prefill) is typically much faster because the whole prompt is processed in parallel, while output (decode) is generated one token at a time and is memory-bandwidth-bound (Source: NVIDIA, 2024). Published “tokens/sec” figures almost always refer to the slower output decode rate, which is the bottleneck for interactive use.
Sources
- Artificial Analysis — Performance Benchmarking Methodology (2026): https://artificialanalysis.ai/methodology/performance-benchmarking
- Artificial Analysis — Llama 3.3 70B Providers (live, 2026): https://artificialanalysis.ai/models/llama-3-3-instruct-70b/providers
- NVIDIA — Streamlining AI Inference with TensorRT-LLM Chunked Prefill (2024): https://developer.nvidia.com/blog/streamlining-ai-inference-performance-and-deployment-with-nvidia-tensorrt-llm-chunked-prefill/
- Baseten — Comparing tokens per second across LLMs (2024): https://www.baseten.co/blog/comparing-tokens-per-second-across-llms/
- Krikri / Greek LLM tokenizer fertility — arXiv:2505.13772 (2025): https://arxiv.org/pdf/2505.13772
- Anyscale — How continuous batching enables 23x throughput in LLM inference (2023): https://www.anyscale.com/blog/continuous-batching-llm-inference
- Cerebras — Llama 3.1 model quality and speed evaluation (2024): https://www.cerebras.ai/blog/llama3.1-model-quality-evaluation-cerebras-groq-together-and-fireworks
- Groq — New AI inference speed benchmark for Llama 3.3 70B (2024): https://groq.com/blog/new-ai-inference-speed-benchmark-for-llama-3-3-70b-powered-by-groq
- Brysbaert, M. (2019) — How many words do we read per minute? A review and meta-analysis of reading rate, Journal of Memory and Language: https://www.sciencedirect.com/science/article/abs/pii/S0749596X19300786