LLM Latency Benchmark: Time-to-First-Token Explained
An LLM latency benchmark measures how long you wait, not how much you get. It tracks time-to-first-token (TTFT), inter-token latency (ITL), and end-to-end latency separately from throughput. On Artificial Analysis live data for Llama 3.3 70B, median TTFT ranges from 0.71s on Google Vertex to 1.22s on Databricks (Source: Artificial Analysis, 2026).
Throughput tells you how many tokens a server can produce per second across all users. Latency tells you how long one person waits for a response. They are different numbers, they trade off against each other, and a system can score brilliantly on one while failing the other. This guide breaks LLM latency into its component metrics, shows real measured figures, and explains how to benchmark each one yourself.
What is an LLM latency benchmark?
An LLM latency benchmark measures the time delays a single user experiences during one request, broken into distinct phases. NVIDIA defines end-to-end latency as TTFT plus generation time, where generation time is inter-token latency multiplied by the number of output tokens (Source: NVIDIA, 2025). Each phase has its own causes and its own fixes.
Most “speed” benchmarks you see report throughput in tokens per second, which is a server-side capacity metric. Latency benchmarking asks a narrower, more user-centric question: from the moment I hit send, how long until I see something, and how smoothly does the rest arrive? The two most-cited latency metrics are TTFT and ITL. For the throughput side of the picture, see our guide to LLM tokens per second.
What is time to first token (TTFT)?
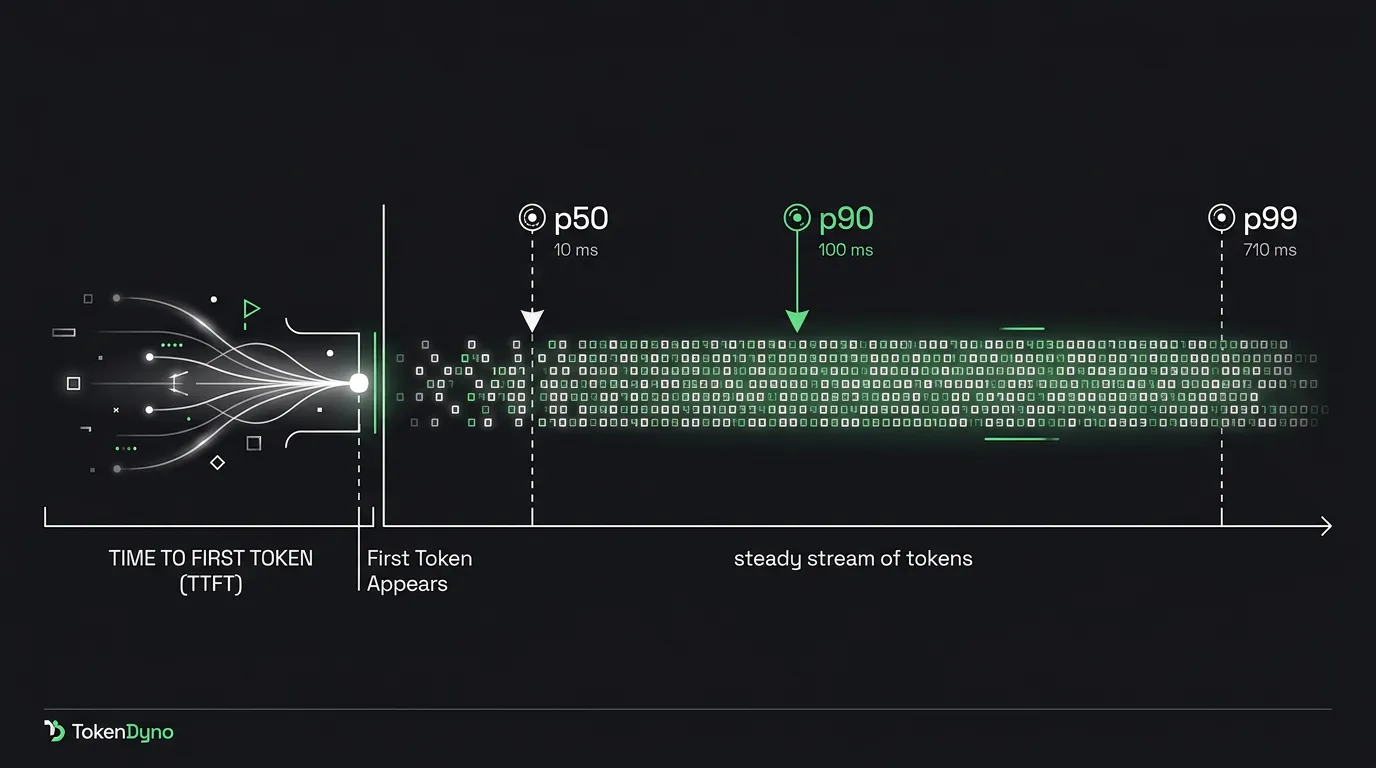
Time to first token is the delay between sending a request and receiving the first output token. It captures prompt processing, queueing, and network round-trip. On Artificial Analysis live data (captured 2026-06-28) for Llama 3.3 70B, median TTFT spans 0.71s on Google Vertex, 0.93s on Groq, and 1.22s on Databricks (Source: Artificial Analysis, 2026).
TTFT is the metric users feel most directly in interactive applications. It is the “spinner time” before any text streams. For a chat interface, a 300ms TTFT feels responsive; a 2-second TTFT feels broken, even if the model then streams quickly. AWS added a server-side TimeToFirstToken CloudWatch metric for Amazon Bedrock in March 2026, defining it as the latency in milliseconds from when Bedrock receives the streaming request to the first response token, specifically so teams can baseline and alert on this number (Source: AWS, 2026).
How is TTFT measured?
TTFT is measured by timestamping the request send and the first streamed token, then taking the difference. NVIDIA’s benchmarking guidance notes that single-concurrency client tooling can introduce overhead accounting for roughly 33% of the entire benchmark duration, so the measurement harness itself matters (Source: NVIDIA, 2025).
The honest pitfall is that TTFT is sensitive to prompt length, because longer prompts take longer to process (the “prefill” phase) before the first token can emit. A TTFT of 200ms on a 100-token prompt is not comparable to 200ms on a 10,000-token prompt. Credible benchmarks fix input length and report it. Artificial Analysis, for example, reports TTFT as a median over a trailing measurement window using standardized prompts (Source: Artificial Analysis, 2026).
What is inter-token latency (ITL)?
Inter-token latency, also called time per output token (TPOT), is the average gap between consecutive tokens after the first one. NVIDIA computes it as end-to-end latency minus TTFT, divided by output tokens minus one, so it isolates the decode phase from the initial prefill (Source: NVIDIA, 2025). It is the inverse of per-user output speed.
If TTFT is the wait before text appears, ITL is the rhythm of text once it starts. An ITL of 100ms means roughly 10 tokens per second per user. Databricks notes that a TPOT of 100ms per token works out to about 10 tokens/sec per user, or around 450 words per minute, which is faster than a typical person reads (Source: Databricks, 2023). Below that rhythm, streaming starts to feel like it is lagging behind the reader.
Why does ITL define how streaming feels?
ITL defines the streaming experience because it sets the pace at which words appear after the first one. NVIDIA notes that per-user tokens-per-second asymptotically approaches the inverse of ITL, so a 50ms ITL caps a single user at roughly 20 tokens/sec regardless of how powerful the server is (Source: NVIDIA, 2025).
This is why aggregate throughput can mislead. A server batching hundreds of requests might report tens of thousands of tokens per second in total, while each individual user still sees a modest per-stream pace governed by ITL. When you read that a provider serves “70,000 tokens/sec,” that is system throughput shared across many users, not the speed any one of them experiences. ITL is the number that controls the reading experience.
What is end-to-end latency?
End-to-end latency is the total time from sending a request to receiving the final token. It equals TTFT plus generation time, where generation time is ITL multiplied by the number of output tokens (Source: Databricks, 2023). It is the metric that matters when a user waits for a complete answer rather than reading a stream.
End-to-end latency is dominated by different components depending on the response length. For a short reply, TTFT dominates: the wait to start is most of the total. For a long generation, like a multi-paragraph report, the ITL-times-token-count term dominates, because hundreds of tokens each add their inter-token gap. This is why optimizing the wrong metric backfires: shaving TTFT does little for a 2,000-token document, and shaving ITL does little for a one-line answer. Match the optimization to the response shape.
How is latency different from throughput?
Latency measures the wait one user experiences; throughput measures total token production across all users. The two are in direct tension: Databricks notes that batching more requests raises throughput but slows per-user generation, because the hardware is shared (Source: Databricks, 2023). Optimizing one often degrades the other.
This tradeoff is the central fact of inference serving. A provider can tune for high throughput (large batches, maximum hardware utilization, lower cost per token) or for low latency (small batches, dedicated capacity, faster individual responses). The same model on the same hardware produces different latency and throughput numbers depending on this choice. NVIDIA frames the distinction as tokens-per-second-per-system (throughput) versus tokens-per-second-per-user (latency-bound), and they are measured separately for a reason (Source: NVIDIA, 2025). For a broader treatment of how these metrics fit together, see our LLM inference benchmark guide.
What does measured LLM latency look like across providers?
Measured latency varies widely across providers serving the same model. On Artificial Analysis live data (captured 2026-06-28) for Llama 3.3 70B, median TTFT ranges from 0.71s to 1.22s while per-user output speed ranges from 322 tokens/sec on Groq down to single digits on slower endpoints (Source: Artificial Analysis, 2026). The table below pairs both metrics.
Measured TTFT and output speed (Llama 3.3 70B, captured 2026-06-28)
| Provider | Median TTFT | Output speed (tokens/sec) | Source |
|---|---|---|---|
| Google Vertex | 0.71s | 130.4 | Artificial Analysis, 2026 |
| Groq | 0.93s | 322.0 | Artificial Analysis, 2026 |
| FriendliAI | 1.02s | — | Artificial Analysis, 2026 |
| CoreWeave | 1.12s | — | Artificial Analysis, 2026 |
| Databricks | 1.22s | — | Artificial Analysis, 2026 |
| SambaNova | — | 282.3 | Artificial Analysis, 2026 |
Note the split: Google Vertex shows the lowest TTFT (fastest to start) but Groq shows far higher output speed (fastest to stream). A provider can win one latency metric and lose another. These figures are medians over a trailing window and drift within hours, so treat any single capture as a snapshot, not a constant.
Controlled engineering benchmarks fill in the decode-phase detail. In NVIDIA’s TensorRT-LLM benchmarking of Llama-3.1-8B (128 input / 128 output tokens), a sample run showed average TTFT of 162.67ms and average TPOT of 7.33ms, illustrating how prefill and decode separate (Source: NVIDIA, 2025). Databricks earlier measured TTFT for a 512-token input at 154ms for Llama2-70B on four A100s, dropping to 114ms on eight (Source: Databricks, 2023). For a model-by-model speed view, see our fastest LLM inference in 2026 leaderboard.
Why does tail latency (p50/p90/p99) matter more than averages?
Tail latency matters because averages hide the slow requests that users actually notice. In NVIDIA’s TensorRT-LLM sample run, average TTFT was 162.67ms but the p99 reached 232.43ms, and average request latency rose to a p99 of 1,137.68ms (Source: NVIDIA, 2025). The worst-case experience is far from the typical one.
Percentiles describe the distribution of response times. The p50 (median) is the middle: half of requests are faster, half slower. The p99 is the value 99% of requests stay under, meaning 1 in 100 requests is at least this slow. Databricks recommends tracking p90 and p95 statistics in high-traffic environments rather than relying on averages, because a long tail is exactly what frustrates real users (Source: Databricks, 2023). BentoML similarly frames p99 as the metric that “can make or break UX in production,” with p90/p95 used when p99 is too noise-sensitive (Source: BentoML, 2026).
There is a measurement caveat. A 2025 paper by Agrawal et al. argues that normalized latency metrics can hide substantial performance variability, such as generation stalls, and that bursty token generation (for example, from speculative decoding) is easily misinterpreted by aggregate numbers (Source: arXiv, 2025). The lesson: report percentiles, and watch the shape of the distribution, not just one summary statistic.
Why does latency matter for UX even when throughput is high?
Latency matters because users experience time, not aggregate capacity. Jakob Nielsen’s long-standing response-time limits hold that 0.1s feels instantaneous, 1s keeps a user’s flow of thought uninterrupted, and 10s is the limit of holding attention, thresholds rooted in human perception that have stayed essentially unchanged for decades (Source: Nielsen Norman Group, 2024).
A high-throughput server can still feel slow to an individual user if TTFT is high or ITL is jerky. This is why streaming exists: by emitting tokens as they generate, an interface keeps the user inside Nielsen’s 1-second flow window even when the full answer takes 10 seconds. BentoML offers example UX targets reflecting this, such as a chatbot TTFT under 200ms for 95% of interactions and code completion under 100ms, while a long report can tolerate up to 30 seconds (Source: BentoML, 2026). The right latency budget depends entirely on the interaction.
How does latency compound in agent workflows?
Latency compounds because agent workflows chain multiple model calls in sequence. End-to-end latency is additive across steps: a five-step agent where each call takes 2 seconds end-to-end waits roughly 10 seconds total before the user sees a result, following the same TTFT-plus-generation arithmetic applied per call (Source: NVIDIA, 2025).
This is the hidden cost of multi-step systems. A single API call with acceptable latency can become an unacceptable wait once it is one link in a chain of tool calls, retrievals, and reasoning steps. In agentic pipelines, TTFT and per-call latency get multiplied by the number of sequential calls, so a metric that looked fine in isolation dominates the user-perceived wait. Latency-sensitive agent designs minimize sequential calls, parallelize where possible, and stream intermediate progress to stay inside attention limits.
How do you run your own LLM latency benchmark?
You benchmark latency by fixing input and output length, sending requests at a known concurrency, and recording TTFT and ITL per request, then reporting percentiles. NVIDIA’s GenAI-Perf, vLLM’s built-in benchmark, and LLMPerf all do this, though they differ in how they handle the first token (Source: NVIDIA, 2025; vLLM, 2026).
Follow a consistent method so your numbers are comparable:
- Fix the workload. Set a standard input length and output length (for example, 128 in / 128 out for chat, longer for documents). TTFT depends on input size, so this must be held constant.
- Set concurrency explicitly. Latency at one concurrent request differs sharply from latency at 50. Report the level you tested.
- Separate the metrics. Record TTFT and ITL distinctly. NVIDIA’s GenAI-Perf subtracts the first token in its ITL formula so the decode phase is isolated (Source: NVIDIA, 2025).
- Match first-token handling across tools. vLLM reports TPOT excluding the first token, and AWS Neuron patches LLMPerf to exclude it too, matching industry convention, so numbers are not comparable unless this is aligned (Source: AWS, 2026; vLLM, 2026).
- Report percentiles, not just means. Capture p50, p90, and p99 for both TTFT and ITL. The tail is where UX breaks.
Because live provider numbers drift hourly, re-run your benchmark close to launch and date-stamp the result.
Frequently asked questions
What is a good LLM latency?
A good latency depends on the interaction. BentoML cites example targets of chatbot TTFT under 200ms for 95% of interactions and code completion under 100ms, while long-form reports can tolerate up to 30 seconds (Source: BentoML, 2026). Nielsen’s 1-second threshold for uninterrupted flow is a useful anchor for interactive apps (Source: Nielsen Norman Group, 2024).
What is time to first token?
Time to first token (TTFT) is the delay between sending a request and receiving the first output token, covering prompt processing, queueing, and network time. On Artificial Analysis live data for Llama 3.3 70B, median TTFT ranges from about 0.71s to 1.22s across providers (Source: Artificial Analysis, 2026). Lower TTFT makes an interface feel more responsive.
How is latency different from throughput?
Latency measures the wait one user experiences; throughput measures total tokens produced across all users per second. They trade off: batching more requests raises throughput but slows per-user generation because hardware is shared (Source: Databricks, 2023). A high-throughput server can still feel slow to an individual if TTFT or inter-token latency is high.
What is inter-token latency?
Inter-token latency (ITL), or time per output token, is the average gap between consecutive tokens after the first. NVIDIA computes it as end-to-end latency minus TTFT, divided by output tokens minus one (Source: NVIDIA, 2025). It sets streaming pace: a 100ms ITL is about 10 tokens/sec per user, roughly 450 words per minute (Source: Databricks, 2023).
Why does p99 latency matter?
The p99 is the latency 99% of requests stay under, so 1 in 100 requests is at least that slow. Averages hide these slow requests: in one NVIDIA sample, average TTFT was 162.67ms but p99 reached 232.43ms (Source: NVIDIA, 2025). Tracking p90/p95/p99 catches the tail that frustrates users (Source: Databricks, 2023).
Does streaming reduce latency?
Streaming does not reduce total end-to-end latency, but it reduces perceived latency by showing tokens as they generate. This keeps users inside Nielsen’s 1-second flow window even when the full answer takes longer (Source: Nielsen Norman Group, 2024). The metric that matters for streaming is TTFT (when text starts) plus ITL (how smoothly it continues).
Sources
- Artificial Analysis, Llama 3.3 70B API provider performance benchmarking (TTFT and output speed, captured 2026-06-28): https://artificialanalysis.ai/models/llama-3-3-instruct-70b/providers
- Artificial Analysis, models leaderboard: https://artificialanalysis.ai/models
- NVIDIA Technical Blog, LLM benchmarking fundamental concepts (TTFT, ITL, end-to-end latency definitions): https://developer.nvidia.com/blog/llm-benchmarking-fundamental-concepts/
- NVIDIA Technical Blog, LLM inference benchmarking performance tuning with TensorRT-LLM (sample TTFT/TPOT/p99 figures): https://developer.nvidia.com/blog/llm-inference-benchmarking-performance-tuning-with-tensorrt-llm/
- Databricks, LLM inference performance engineering best practices (latency vs throughput, TPOT/reading-speed, TTFT measurements): https://www.databricks.com/blog/llm-inference-performance-engineering-best-practices
- BentoML, LLM inference metrics handbook (E2E latency, goodput, p99, SLO targets): https://bentoml.com/llm/llm-inference-basics/llm-inference-metrics
- AWS Machine Learning Blog, new CloudWatch metrics for TTFT on Amazon Bedrock: https://aws.amazon.com/blogs/machine-learning/improve-operational-visibility-for-inference-workloads-on-amazon-bedrock-with-new-cloudwatch-metrics-for-ttft-and-estimated-quota-consumption/
- AWS Neuron docs, LLM inference benchmarking guide (LLMPerf first-token handling): https://awsdocs-neuron.readthedocs-hosted.com/en/latest/libraries/nxd-inference/developer_guides/llm-inference-benchmarking-guide.html
- vLLM docs, benchmark CLI (TPOT/ITL reporting): https://docs.vllm.ai/en/latest/benchmarking/cli/
- arXiv 2507.09019, Agrawal et al., on normalized latency metrics hiding variability: https://arxiv.org/abs/2507.09019
- Nielsen Norman Group, Response Times: The 3 Important Limits: https://www.nngroup.com/articles/response-times-3-important-limits/