LLM Inference Benchmark: Speed vs Quality Trade-offs
An LLM inference benchmark measures how fast a model serves tokens. It does not measure how smart the model is. It tracks output tokens per second, time to first token (TTFT), and end-to-end latency on real API endpoints (Source: NVIDIA, 2025). But raw speed never tells the whole story. The best model for your product sits on a frontier where speed, quality, and cost pull against each other.
This guide explains what an inference benchmark actually tests. It shows how that differs from a capability benchmark. And it shows why “fastest” rarely means “best.” Every number below comes from a named 2025-2026 source you can check yourself.
What is an LLM inference benchmark?
An LLM inference benchmark measures the serving speed of a deployed model. It reports output tokens per second, time to first token, and request latency from live API calls (Source: Artificial Analysis, 2026). It answers one question. How fast does this model deliver tokens to a user, in real conditions, right now?
An inference benchmark treats the model as fixed and tests the system that serves it. Hardware, batching, quantization, and provider all change the result, so the same model name can post very different speeds. This is why trackers like Artificial Analysis publish a median over a rolling 72-hour window. They sample it many times a day, not as one fixed figure (Source: Artificial Analysis, 2026). The output is a snapshot of delivery speed, not a fixed property of the model.
What does an inference benchmark actually test?
An inference benchmark tests the serving stack, not the model’s knowledge. It measures prompt processing time, token generation speed, and how those hold up under load (Source: NVIDIA, 2025). The model’s training and weights stay constant; what varies is the system delivering each token.
Three things move every result. Hardware sets the ceiling: SRAM-based inference chips generate tokens faster than HBM-based GPUs. Batching trades per-user speed for total throughput as more requests share the same chip. Precision matters too, since an FP8 endpoint runs faster than a BF16 one under the same model name (Source: Artificial Analysis, 2026). Change any of these and the benchmark moves, even though the model is identical. That is the core insight: an inference benchmark grades delivery, not intelligence.
What metrics does an LLM inference benchmark track?
A standard inference benchmark tracks four metrics. They are time to first token (TTFT), inter-token latency (ITL, also called TPOT), output tokens per second, and end-to-end request latency (Source: NVIDIA, 2025). Together they describe both how long a user waits and how fast the answer streams once it starts.
Each metric answers a different question. TTFT measures the wait before any text appears. Inter-token latency measures the gap between each token after that. Output tokens per second captures sustained speed. It is the number most people mean by “fast.” End-to-end latency sums it all: TTFT plus generation time for the full response (Source: NVIDIA, 2025). A chatbot lives or dies on TTFT; a long document summarizer cares more about tokens per second. No single number covers every workload, which is why serious benchmarks report several.
How are TTFT and inter-token latency different?
TTFT is the time to process the prompt and produce the first token; it grows with longer prompts because the model must read the whole input first. Inter-token latency is the average gap between later tokens. It equals end-to-end latency minus TTFT, divided by the remaining tokens (Source: NVIDIA, 2025).
The split matters because the two phases stress different parts of the system. TTFT reflects the prefill phase, where the model ingests your prompt and builds its cache; a 10,000-token prompt pushes TTFT up sharply. Inter-token latency reflects the decode phase, where the model emits one token at a time. A code assistant needs low TTFT so suggestions feel instant. A report generator needs low inter-token latency so a long answer finishes quickly. Benchmarks that report only one metric hide half the picture.
How is an inference benchmark different from a capability benchmark?
An inference benchmark measures speed and cost of serving; a capability benchmark measures intelligence. Capability suites grade how well a model thinks. The Artificial Analysis Intelligence Index, for one, blends reasoning, coding, and science tests such as GPQA Diamond, SciCode, and Humanity’s Last Exam (Source: Artificial Analysis, 2026). One grades delivery, the other grades correctness.
These are separate axes, and a model can win on one while losing on the other. The Intelligence Index v4.1 blends nine tests, such as GDPval-AA v2, Terminal-Bench, and AA-Omniscience, to score how well a model thinks (Source: Artificial Analysis, 2026). None of that touches tokens per second. An inference benchmark, by contrast, ignores whether the answer is right and only times how fast it arrives. You need both readings before choosing a model: speed without quality ships fast nonsense, and quality without speed frustrates users.
What does a capability benchmark test instead?
A capability benchmark tests reasoning, knowledge, and task accuracy. It runs fixed problem sets and scores correctness, not timing. The Artificial Analysis Intelligence Index, for example, weights nine tests spanning agentic terminal tasks, science, and long-context recall (Source: Artificial Analysis, 2026).
Capability scores barely line up with speed. On current data, the fastest models are small ones. Mercury 2 hits 805.7 tokens per second, yet scores far below frontier reasoning models on intelligence (Source: Artificial Analysis, 2026). Meanwhile Claude Opus 4.8, near the top of the Intelligence Index at 56, runs at just 58.7 tokens per second (Source: Artificial Analysis, 2026). Speed and quality sit on different axes. So you cannot read one benchmark and guess the other. The comparison table below makes that gap concrete.
Why isn’t faster inference always better?
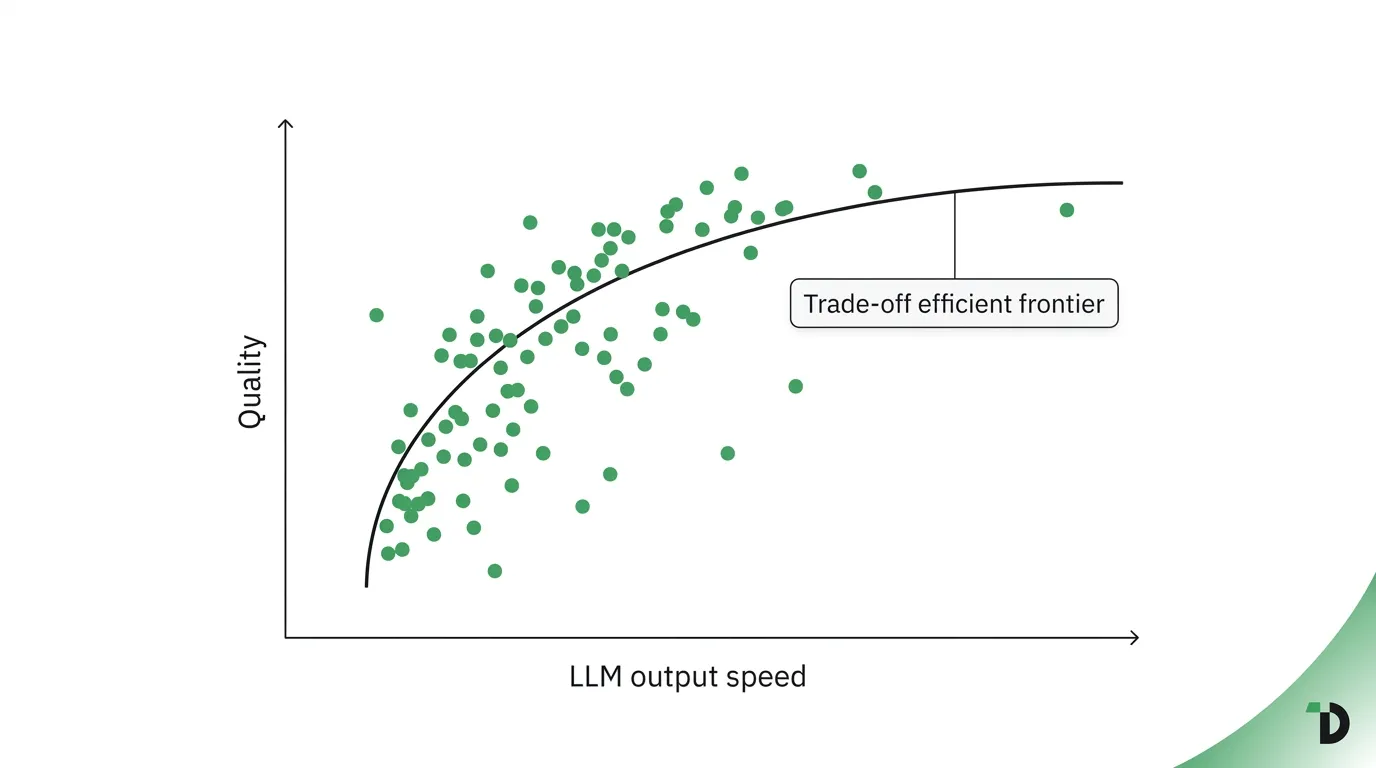
Faster inference is not always better because speed, quality, and cost form a frontier, and pushing one usually costs another. The fastest model on Artificial Analysis is Mercury 2, at 805.7 tokens per second. It scores well below frontier reasoning models on quality. The smartest models run an order of magnitude slower (Source: Artificial Analysis, 2026).
This trade-off is built in, not a temporary gap. Frontier reasoning models “think” before answering, spending tokens and time to reach higher accuracy, which lowers their output speed. Small models skip that and stream tokens quickly but score lower on hard tasks. Cost adds a third axis. A fast, cheap model can be the right pick for high-volume sorting tasks. A slow, costly frontier model earns its keep on hard reasoning. The table below shows how five real models land on that speed-quality-cost frontier.
How do real models compare on speed, quality, and cost?
The spread is wide. Output speed ranges from 58.7 to 805.7 tokens per second across these models. Intelligence runs from low to 56. Output price runs from a few cents to $30 per million tokens (Source: Artificial Analysis, 2026). No model wins all three columns, which is exactly what a frontier looks like.
| Model | Output speed (tokens/sec) | Intelligence Index | Price (input / output per 1M) | Source |
|---|---|---|---|---|
| Mercury 2 | 805.7 | Low (speed leader) | — | Artificial Analysis, 2026 |
| Gemini 3 Flash (Reasoning) | 167.0 | 38 | $0.50 / $3.00 | Artificial Analysis, 2026 |
| DeepSeek V4 Flash (Reasoning, Max) | 103.0 | 40 | Budget tier | Artificial Analysis, 2026 |
| DeepSeek V4 Pro (Reasoning, Max) | 80.0 | 44 | $0.45 input | Artificial Analysis, 2026 |
| GPT-5.5 (xhigh) | 77.1 | 55 | $5.00 / $30.00 | Artificial Analysis, 2026 |
| Claude Opus 4.8 (Max Effort) | 58.7 | 56 | $5.00 / $25.00 | Artificial Analysis, 2026 |
Read the table top to bottom and the frontier is obvious. Mercury 2 leads on speed but trails on intelligence. Claude Opus 4.8 and GPT-5.5 top the intelligence column. Yet they sit near the bottom on speed, around 58 to 77 tokens per second (Source: Artificial Analysis, 2026). Gemini 3 Flash threads the middle. It runs at 167 tokens per second, with a mid-tier score of 38 and a low $0.50 input price (Source: Artificial Analysis, 2026). The right choice depends on which column your workload values most. For more model-by-model speed detail, see our LLM speed comparison.
How do batching and concurrency change benchmark results?
Batching changes inference benchmarks more than almost any other factor. As more requests run at once, total system throughput climbs until the hardware saturates. But per-user speed falls, because each user’s tokens compete for the same chip (Source: NVIDIA, 2025). A single-user record and a busy production endpoint can differ several-fold.
This is why one model shows two very different “speeds.” Throughput per system measures total output tokens per second across all live requests at once. It is the number a provider cares about for cost. Speed per user measures one person’s experience and approaches the inverse of inter-token latency as answers get longer (Source: NVIDIA, 2025). Vendor “world record” numbers usually report single-stream, latency-tuned runs. The benchmark you should trust matches your real concurrency. If you serve many users at once, a single-user record overstates what each of them will feel.
What standards define LLM inference benchmarking?
MLPerf Inference, run by MLCommons, is the main industry standard. Its v5.1 round (September 2025) benchmarks Llama 3.1 8B for small-LLM serving. It splits each run into a prefill phase, measured by TTFT, and a generation phase, measured by TPOT (Source: MLCommons, 2025). It sets clear latency limits so results compare fairly.
MLPerf defines two server modes with hard limits. The standard server mode caps TTFT at 2 seconds and TPOT at 100 milliseconds, roughly 480 words per minute. A new interactive mode is stricter. It caps TTFT under 0.5 seconds and TPOT under 30 milliseconds, about 1,600 words per minute, to model code assistants and real-time tools (Source: MLCommons, 2025). Independent trackers like Artificial Analysis add to MLPerf by measuring live commercial APIs instead of controlled hardware submissions (Source: Artificial Analysis, 2026). Together they cover both lab-grade and real-world speed.
Why do published records exceed live benchmark numbers?
Published records exceed live numbers because they measure peak, single-stream, latency-tuned runs rather than sustained live traffic. Independent trackers report a median over a 72-hour window across real endpoints, which includes load, batching, and demand spikes (Source: Artificial Analysis, 2026). Records show the best case; live medians show the typical case.
Both numbers are real, but they answer different questions. A vendor record tells you the ceiling under ideal conditions, often FP8 with speculative decoding and custom kernels. A live median tells you what a normal API key delivers today. Say a headline claims thousands of tokens per second, but the live page for that model tops out far lower. The gap is usually availability or batch setup. It is not a number you can call live. Always check which kind of benchmark you are reading before you plan around it.
How should you read an inference benchmark for your use case?
Start by fixing the model on quality grounds, then rank serving options by the speed metric your workload needs. Use TTFT for chat. Use output tokens per second for long answers. Use total cost per million tokens for high-volume jobs (Source: NVIDIA, 2025; Artificial Analysis, 2026). One metric rarely fits every product.
Match the benchmark to what users feel. A code assistant needs low TTFT, so weight first-token latency above raw throughput. A document summarizer streams long answers, so output tokens per second dominates. A batch pipeline processing millions of records cares about throughput and price, not per-user latency. Then confirm the precision label and concurrency assumptions behind any number, since an FP8 endpoint or a single-user record can flatter a model. TokenDyno tracks these output-tokens-per-second figures live across providers so you compare current data, not stale claims. For the unit itself, see LLM Tokens Per Second; for current leaders, see Fastest LLM Inference in 2026.
Frequently asked questions
What is an LLM inference benchmark?
An LLM inference benchmark measures how fast a deployed model serves tokens, not how intelligent it is. It tracks output tokens per second, time to first token, inter-token latency, and end-to-end request latency on live endpoints (Source: NVIDIA, 2025). Results shift with hardware, batching, and precision, so trackers report rolling medians.
What’s the difference between an inference and a capability benchmark?
An inference benchmark measures serving speed and cost; a capability benchmark measures intelligence and accuracy. Capability suites like the Artificial Analysis Intelligence Index score reasoning, coding, and science across nine evaluations (Source: Artificial Analysis, 2026). The two barely correlate: the fastest models are often the least capable, and frontier models run slowest.
Is faster inference always better?
No. Speed, quality, and cost form a trade-off frontier. The fastest model on Artificial Analysis is Mercury 2, at 805.7 tokens per second, yet it scores far below frontier reasoning models. Claude Opus 4.8 leads on intelligence at just 58.7 tokens per second (Source: Artificial Analysis, 2026). The right pick depends on your workload.
What metrics matter most in an inference benchmark?
The four core metrics are time to first token, inter-token latency (TPOT), output tokens per second, and end-to-end latency (Source: NVIDIA, 2025). TTFT matters most for interactive chat and code completion; output tokens per second matters most for long-form generation. Use the metric that matches how users experience your product.
Why do benchmark speeds vary so much for the same model?
Speeds vary with batching, quantization, hardware, context length, and live demand. Per-user speed drops as providers pack more requests onto the same chip. FP8 endpoints also run faster than full-precision ones (Source: NVIDIA, 2025; Artificial Analysis, 2026). That is why trackers publish medians over a 72-hour window instead of one figure.
What is a good tokens-per-second speed?
It depends on the use case. Roughly 200 tokens per second supports smooth real-time streaming, while under 50 tokens per second can feel sluggish in interactive apps (Source: NVIDIA, 2025). MLPerf’s interactive mode targets TPOT under 30 milliseconds, about 1,600 words per minute, for code assistants (Source: MLCommons, 2025).
Sources
- NVIDIA, LLM Inference Benchmarking: Fundamental Concepts: https://developer.nvidia.com/blog/llm-benchmarking-fundamental-concepts/
- Artificial Analysis, Performance Benchmarking Methodology: https://artificialanalysis.ai/methodology/performance-benchmarking
- Artificial Analysis, Intelligence Index evaluations: https://artificialanalysis.ai/evaluations/artificial-analysis-intelligence-index
- Artificial Analysis, model comparison (Intelligence, Performance, Price): https://artificialanalysis.ai/models
- Artificial Analysis, Gemini 3 Flash: https://artificialanalysis.ai/models/gemini-3-flash-reasoning
- Artificial Analysis, GPT-5.5 (xhigh): https://artificialanalysis.ai/models/gpt-5-5
- Artificial Analysis, Claude Opus 4.8: https://artificialanalysis.ai/models/claude-opus-4-8
- Artificial Analysis, DeepSeek V4 Pro: https://artificialanalysis.ai/models/deepseek-v4-pro
- Artificial Analysis, DeepSeek V4 Flash: https://artificialanalysis.ai/models/deepseek-v4-flash
- MLCommons, MLPerf Inference 5.1 (Small LLM, Llama 3.1 8B): https://mlcommons.org/2025/09/small-llm-inference-5-1/