Provider Throughput Report: Q3 2026 LLM Inference Speeds
This is a dated snapshot. As of the Q3 2026 reporting window, the gap between the fastest and slowest provider serving the same model is roughly 34x: on OpenAI’s gpt-oss-120b, Cerebras measured 1,753.0 output tokens/second against DeepInfra’s 51.7 tokens/second, identical weights (Source: Artificial Analysis, 2026). Throughput is not a property of a model; it is a property of the model-and-provider pair, and it moves. Every figure below is verified against a named source and carries a date. None of these numbers is permanent, and the report explains where to read the live versions.
How fast are LLM providers in Q3 2026?
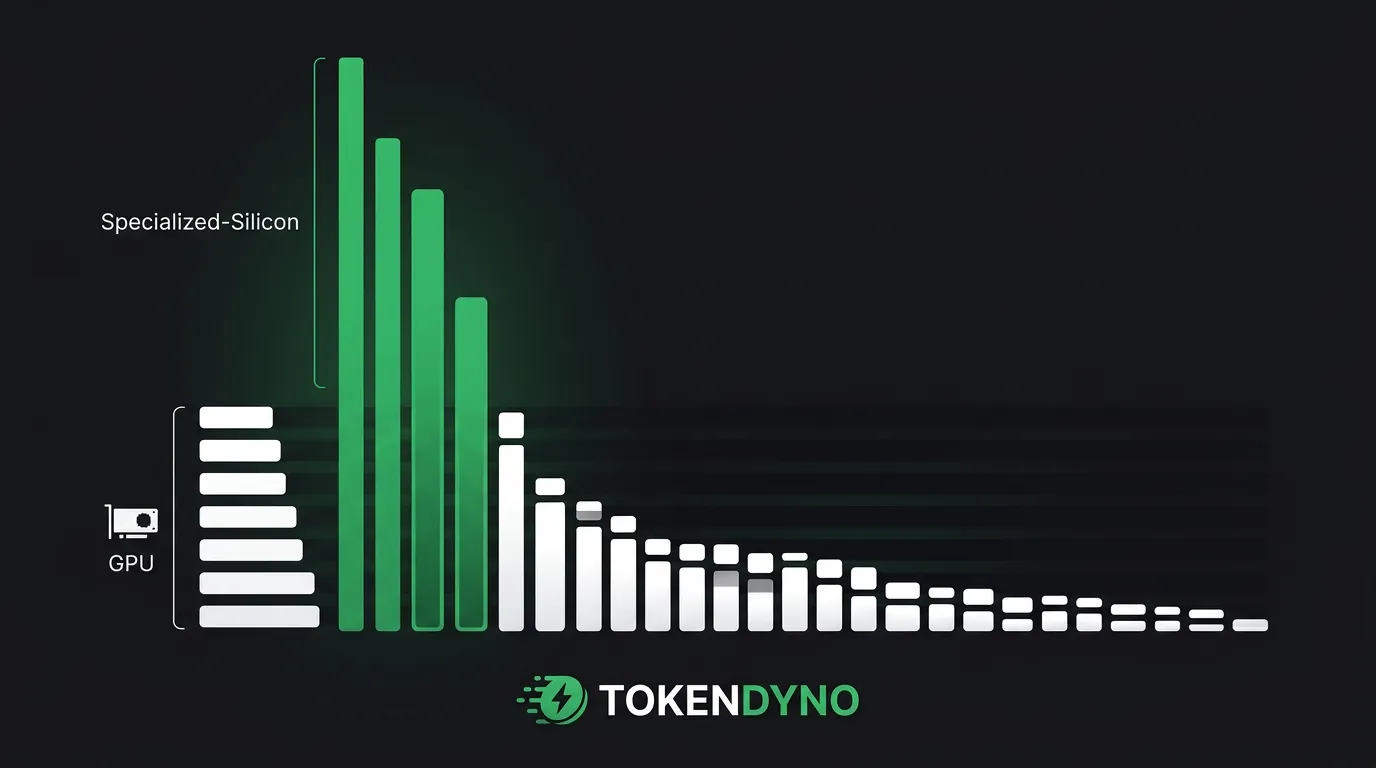
The throughput leaders are specialized-silicon inference clouds, not commodity GPU hosts. On gpt-oss-120b, the fastest providers by median output speed are Cerebras at 1,753.0 tokens/second, SambaNova at 692.7, and Fireworks at 690.1, with Groq at 477.6 and the slowest tracked endpoint, DeepInfra, at 51.7 (Source: Artificial Analysis, 2026). The spread across one model is 33.9x.
Artificial Analysis measures these figures as a median (P50) over a rolling 72-hour window, sampling single-request speed eight times a day against a standardized 10,000-input-token workload (Source: Artificial Analysis, 2026). That methodology matters: it means the standings reflect production-shaped load, not a vendor’s best single-stream demo, and it is why the same provider can post different numbers week to week.
Which provider leads on output tokens/sec?
Cerebras leads the gpt-oss-120b board at 1,753.0 tokens/second, roughly 2.5x the next-fastest tracked endpoint (SambaNova, 692.7) and 33.9x the slowest (DeepInfra, 51.7) (Source: Artificial Analysis, 2026). The pattern holds across the open-weights models that specialized silicon supports: wafer-scale and dataflow architectures sit at the top, commodity-GPU hosts fill the long tail. The lead is real and independently measured, but it is also narrow in scope, because the fastest providers serve only a handful of ported models.
Why does the same model vary so much across providers?
Because output speed reflects hardware and serving configuration, not the model’s weights. The same checkpoint runs on a custom inference chip with the whole model in on-chip memory, or on a shared GPU pool under variable load. For gpt-oss-120b, that difference is a 33.9x range across tracked providers (Source: Artificial Analysis, 2026). The practical consequence: “how fast is model X” has no answer until you also name the provider, the workload, and the date you measured.
What does the Q3 2026 provider speed table look like?
Here are the verified output-speed standings for gpt-oss-120b, the most widely benchmarked open model this quarter, available across 20 API providers. Each row is a median over Artificial Analysis’s 72-hour rolling window against a 10,000-input-token workload (Source: Artificial Analysis, 2026). Figures are output tokens per second; higher is faster.
| Provider (gpt-oss-120b) | Output speed (tokens/sec) | Source |
|---|---|---|
| Cerebras | 1,753.0 | Artificial Analysis, 2026 |
| SambaNova | 692.7 | Artificial Analysis, 2026 |
| Fireworks | 690.1 | Artificial Analysis, 2026 |
| Together AI | 563.5 | Artificial Analysis, 2026 |
| Groq | 477.6 | Artificial Analysis, 2026 |
| DeepInfra | 51.7 | Artificial Analysis, 2026 |
Source: Artificial Analysis, gpt-oss-120b API Provider Performance Benchmark, 2026 (median over 72-hour rolling window; values move with load and re-tuning).
The ordering is stable in shape but not in exact value. The top three change places as providers re-tune kernels and adjust batch policy; the headline takeaway, that specialized silicon clusters at the top and GPU hosts spread across the bottom, has held through 2026. For the methodology behind these measurements, see LLM Throughput Benchmark.
How do TTFT (time to first token) standings compare?
Throughput and latency are different races, and the leaderboard reorders when you switch metrics. Time to first token (TTFT) measures responsiveness, the wait before the first chunk streams, and it is dominated by queueing and prefill rather than raw generation speed. On DeepSeek R1 (0528), DeepInfra posted the lowest TTFT at 0.61s while Google Vertex led output speed at 150.8 tokens/second (Source: Artificial Analysis, 2026).
That split is the point: the provider that streams the most tokens per second is not always the one that answers first. A throughput leader can carry a higher TTFT under load, and a latency leader can sit mid-pack on tokens per second. Reading both columns together is the only way to size a provider for a specific workload.
Which providers post the lowest TTFT?
For a clean per-provider view with both metrics verified on the same model, DeepSeek R1 (0528) gives a tight comparison. Output speed and TTFT below are from the same 72-hour window, so each row is internally consistent (Source: Artificial Analysis, 2026).
| Provider (DeepSeek R1 0528) | Output speed (tokens/sec) | TTFT (s) | Source |
|---|---|---|---|
| Google Vertex | 150.8 | 1.08 | Artificial Analysis, 2026 |
| Azure | 81.6 | 1.71 | Artificial Analysis, 2026 |
| DeepInfra | 71.9 | 0.61 | Artificial Analysis, 2026 |
Source: Artificial Analysis, DeepSeek R1 (0528) API Provider Performance Benchmark, 2026 (median over 72-hour rolling window). Note: for reasoning models, “time to first answer token,” which includes hidden reasoning, runs far higher than raw TTFT.
Note the inversion: Google Vertex is roughly 2x faster than DeepInfra on output speed, yet DeepInfra answers first by about 0.47s (Source: Artificial Analysis, 2026). For reasoning models a second clock matters too, time to the first visible answer token, which includes the model’s hidden deliberation and can run 10-30x the raw TTFT. For how these metrics interact when picking a model, see Fastest LLM Inference in 2026.
Specialized silicon vs GPU: who actually wins in Q3 2026?
On single-stream output speed, specialized silicon leads by a wide margin; on aggregate rack throughput, GPU systems remain formidable. These are two different races and the numbers below should never be compared across them. Cerebras reported roughly 3,000 tokens/second on gpt-oss-120b on its Wafer Scale Engine 3, while the fastest published NVIDIA-GPU result for the same model was about 650 tokens/second (Sources: Cerebras, 2025; Baseten, 2025).
The single-stream gap is the headline most readers want, and it is real: per-user, custom inference chips are several times faster than the best-tuned GPU endpoint on the open models they support. But silicon vendors also publish aggregate figures, total tokens/second across thousands of concurrent users, that look enormous and measure something else entirely.
How fast is NVIDIA Blackwell on the same model?
Baseten published the fastest verified NVIDIA-GPU result for gpt-oss-120b at roughly 650 tokens/second on B200 hardware (8x B200, TensorRT-LLM with speculative decoding), up about 60% from an earlier ~400 tokens/second, and independently ranked by Artificial Analysis as the fastest NVIDIA-based API for the model (Source: Baseten, 2025). Separately, NVIDIA reported about 1.5 million tokens/second in aggregate on a GB200 NVL72 rack serving gpt-oss-120b to roughly 50,000 concurrent users (Source: NVIDIA, 2025). That 1.5M figure is total system throughput, not per-user speed; per user it implies roughly 30 tokens/second.
What do MLPerf’s hardware benchmarks show?
For vendor-neutral hardware results, the reference is MLPerf Inference v5.1, published September 2025 (Source: NVIDIA / MLCommons, 2025). On that round, NVIDIA’s Blackwell Ultra (GB300 NVL72) set per-GPU records including about 5,842 tokens/second per GPU offline on DeepSeek-R1 and up to roughly 13,015 tokens/second per GPU offline on Llama 2 70B, with GB300 delivering about 1.4x the per-GPU throughput of GB200 (Source: NVIDIA / MLCommons, 2025). These are throughput-mode figures for fleet economics, not the single-user latency a chat product feels, which is exactly why the silicon leaders and the GPU leaders both look dominant depending on which column you read.
What changed versus the prior quarter?
The competitive set moved faster than the rankings did. The shape of the board, specialized silicon on top, GPU hosts trailing, was stable across 2026, but three documented events reshaped expectations for upcoming quarters. SambaNova announced its SN50 RDU in February 2026, NVIDIA licensed Groq’s inference IP at GTC in March 2026, and Groq raised $650 million in June 2026 to expand its inference cloud (Sources: SambaNova/BusinessWire, 2026; IEEE Spectrum, 2026; SiliconANGLE, 2026).
None of those events is yet reflected in the verified P50 standings above, which is the core reason this report is a dated snapshot rather than a permanent ranking. New silicon ships, providers re-tune kernels, and the next quarter’s table will differ.
Which new silicon is entering the race in 2026?
SambaNova’s SN50 is the headline new entrant, claiming 895 tokens/second per user on Llama 3.3 70B versus 184 tokens/second per user on an NVIDIA B200, roughly 4.9x (Source: SambaNova, 2026). Treat that as an unvalidated vendor figure: it carries no MLPerf submission or independent lab confirmation, and SambaNova lists SN50 availability for the second half of 2026, so it does not appear in this quarter’s measured board. Separately, NVIDIA’s GTC 2026 licensing of Groq’s LPU IP signals that the GPU incumbent is absorbing dataflow techniques, though no tokens/second figure was published for that effort (Source: IEEE Spectrum, 2026). The watchlist for the next report is set; the verified numbers are not in yet.
How should you read this Q3 2026 snapshot?
Read it as a dated photograph, not a constant. The standings here were captured for a Q3 2026 window from rolling 72-hour medians, and they drift as load shifts, providers re-tune, and new chips ship (Source: Artificial Analysis, 2026). The durable findings, that throughput is a model-and-provider property with a ~34x spread, that throughput and TTFT rank differently, and that specialized silicon leads single-stream speed, will outlast any specific row in the tables.
Before you make a serving decision, re-check the live boards rather than these dated figures. Artificial Analysis publishes continuously updated per-provider speed and latency, and TokenDyno maintains a live tokens/second leaderboard in the same spirit; use either as the current source and treat this report as the historical baseline. For how often these numbers move, see Live LLM Benchmark Updates.
Frequently asked questions
Which provider is fastest in 2026?
For single-stream output speed on the open models it supports, Cerebras leads this quarter’s measured board: about 1,753.0 tokens/second on gpt-oss-120b, roughly 33.9x the slowest tracked endpoint (Source: Artificial Analysis, 2026). “Fastest” depends on the model and metric, since latency leaders differ from throughput leaders.
How do provider speeds change over time?
Continuously. Artificial Analysis reports a median over a rolling 72-hour window, sampled eight times a day, so figures move with load and provider re-tuning (Source: Artificial Analysis, 2026). Across 2026 the board’s shape stayed stable while exact values shifted, and new silicon like SambaNova’s SN50 is expected to reorder it.
What is the difference between throughput and TTFT?
Throughput is output tokens per second once generation is underway; TTFT is the wait before the first token streams. They rank providers differently: on DeepSeek R1, Google Vertex led output speed at 150.8 tokens/second while DeepInfra answered first at 0.61s TTFT (Source: Artificial Analysis, 2026). Size a provider on both.
Does specialized silicon beat GPUs on speed?
On per-user single-stream speed for supported open models, yes by a wide margin: Cerebras reported about 3,000 tokens/second on gpt-oss-120b versus roughly 650 on the fastest NVIDIA-GPU endpoint (Sources: Cerebras, 2025; Baseten, 2025). On aggregate rack throughput, GPU systems remain extremely strong, so the answer depends on the metric.
Where can I see live LLM speeds?
Use a continuously updated benchmark rather than a dated report. Artificial Analysis publishes live per-provider output speed and latency, sampled multiple times a day, so it reflects current standings (Source: Artificial Analysis, 2026). This report is a Q3 2026 baseline that will drift as load shifts and new silicon ships.
Key takeaways
As of this Q3 2026 snapshot, throughput is a model-and-provider property, not a model property: gpt-oss-120b ran 33.9x faster on Cerebras (1,753.0 tokens/second) than on DeepInfra (51.7) in the same benchmark (Source: Artificial Analysis, 2026). Specialized silicon leads single-stream output speed, with Cerebras near 3,000 tokens/second on gpt-oss-120b versus about 650 on the fastest GPU endpoint (Sources: Cerebras, 2025; Baseten, 2025). Throughput and TTFT rank providers differently, so read both columns.
This is a dated photograph. New entrants (SambaNova SN50, NVIDIA-Groq licensing) will reshape the next report, and all figures here are rolling medians that drift. Re-check a live board before any serving decision, and treat these standings as a historical baseline rather than a constant.
Sources
- Artificial Analysis, gpt-oss-120b API Provider Performance Benchmark, 2026: https://artificialanalysis.ai/models/gpt-oss-120b/providers
- Artificial Analysis, DeepSeek R1 (0528) API Provider Performance Benchmark, 2026: https://artificialanalysis.ai/models/deepseek-r1/providers
- Artificial Analysis, LLM Leaderboard (output speed and latency methodology), 2026: https://artificialanalysis.ai/leaderboards/models
- Cerebras, “Cerebras launches OpenAI’s gpt-oss-120B at a blistering 3,000 tokens/sec,” 2025: https://www.cerebras.ai/blog/cerebras-launches-openai-s-gpt-oss-120b-at-a-blistering-3-000-tokens-sec
- Baseten, “How we made the fastest GPT-OSS on NVIDIA GPUs,” 2025: https://www.baseten.co/blog/how-we-made-the-fastest-gpt-oss-on-nvidia-gpus-60-percent-faster/
- NVIDIA, “Delivering 1.5M TPS inference on NVIDIA GB200 NVL72,” 2025: https://developer.nvidia.com/blog/delivering-1-5-m-tps-inference-on-nvidia-gb200-nvl72-nvidia-accelerates-openai-gpt-oss-models-from-cloud-to-edge/
- NVIDIA / MLCommons, “NVIDIA Blackwell Ultra sets new inference records in MLPerf Inference v5.1,” 2025: https://developer.nvidia.com/blog/nvidia-blackwell-ultra-sets-new-inference-records-in-mlperf-debut/
- SambaNova / BusinessWire, “SambaNova introduces the SN50 RDU,” 2026: https://sambanova.ai/blog/introducing-the-sn50-rdu-purpose-built-for-agentic-inference
- IEEE Spectrum, “NVIDIA licenses Groq’s inference IP,” 2026: https://spectrum.ieee.org/nvidia-groq-3
- SiliconANGLE, “Inference chip startup Groq raises $650M to grow cloud platform,” 2026: https://siliconangle.com/2026/06/22/inference-chip-startup-groq-raises-650m-grow-cloud-platform/