LLM Throughput Benchmark: Tokens/sec by GPU and Provider
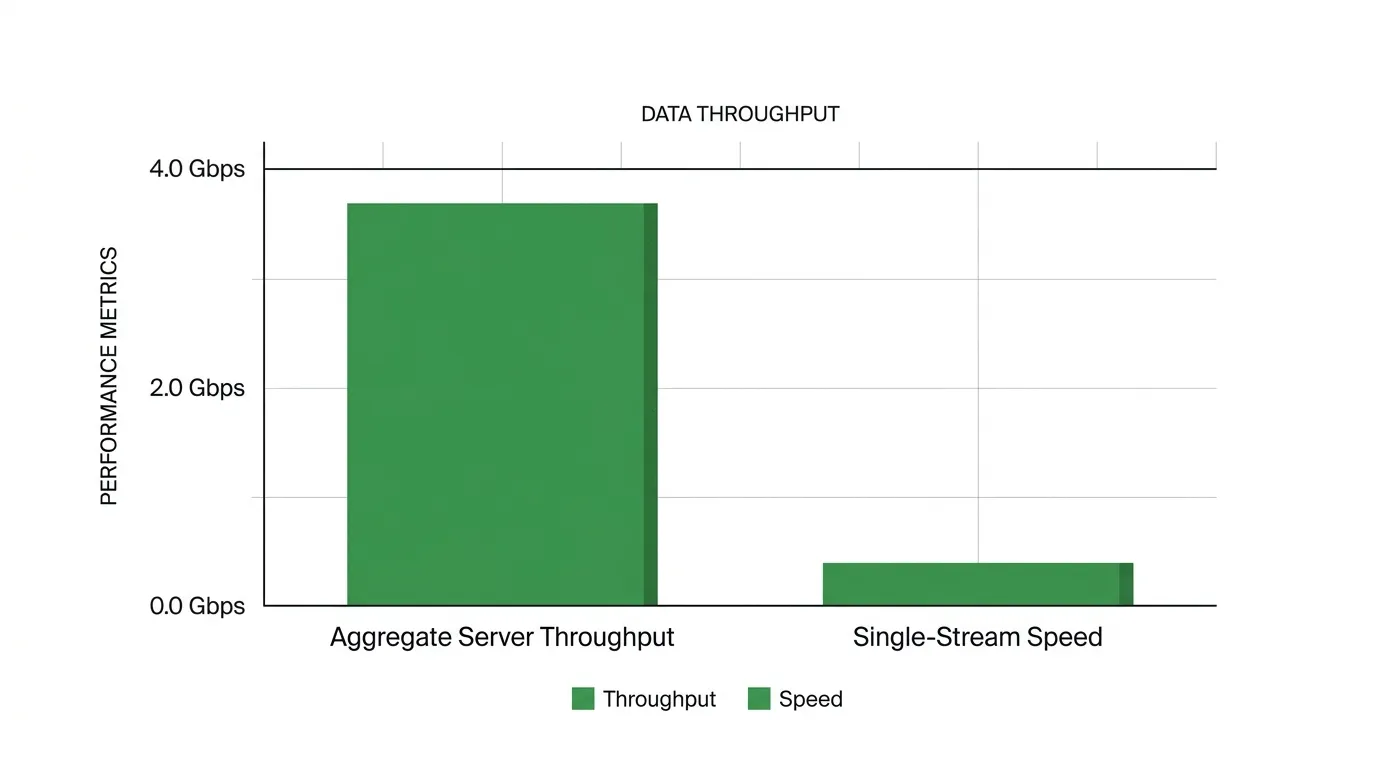
LLM throughput splits into two numbers that are easy to confuse. A single NVIDIA DGX B200 server generates over 1,000 tokens/sec for one user on Llama 4 Maverick, but up to 72,000 tokens/sec across all concurrent users at its highest-throughput setting (Source: NVIDIA, 2025). Same hardware, same model, a 70x gap. Which number you need depends entirely on your workload.
This benchmark separates those two ideas, ranks current hardware and providers on each, and shows why GPU and accelerator choice drives the result. Every figure below comes from a named 2025-2026 source with a link. Because vendors re-optimize endpoints constantly and benchmarks like InferenceMAX re-run nightly, treat each number as a dated snapshot, not a constant.
What is LLM throughput, and how is it different from speed?
Throughput is the total tokens/sec a system produces across every request it serves at once. Single-stream speed, or output tokens/sec, is what one user sees while their answer streams. Artificial Analysis defines output speed as a per-user metric and system throughput as total tokens across all concurrent requests (Source: Artificial Analysis, 2026).
The distinction matters because the two move in opposite directions. When a server packs more requests into a batch, aggregate throughput climbs while each individual user’s token generation speed falls. A chatbot product cares about per-user speed; a batch summarization pipeline or an evaluation run cares about aggregate throughput per dollar. For the per-user side of this story, see our guide on LLM tokens per second.
How is aggregate throughput measured?
Aggregate throughput is measured by loading a system with many concurrent requests and counting all output tokens per second the hardware sustains. Standardized benchmarks fix the model, input and output lengths, and a latency target, then report total tokens/sec. MLPerf Inference (run by MLCommons) and NVIDIA’s open-source InferenceMAX both publish server and offline throughput this way (Source: MLCommons, 2025).
The cleanest single illustration comes from Artificial Analysis testing eight B200 GPUs on gpt-oss-120B: 403 output tokens/sec per query, but 92,909 output tokens/sec at peak system throughput (Source: Artificial Analysis, 2026). One machine, one model, two numbers 230x apart. Any throughput benchmark that does not say which one it reports is unreadable.
How much aggregate throughput does a GPU server deliver?
A modern 8-GPU server delivers tens of thousands of aggregate tokens/sec on a 70B-class model. In MLPerf Inference v5.0, eight NVIDIA B200 GPUs served Llama 2 70B at 98,443 tokens/sec in the server scenario, against 33,072 tokens/sec for eight H200 GPUs on the same task, roughly a 3x generational jump (Source: NVIDIA, 2025).
Those are standardized, audited figures, which makes them the most useful baseline for comparing hardware generations honestly. The table below maps verified aggregate throughput (and the per-user records where relevant) onto specific hardware. Every row carries its own source.
Aggregate throughput by hardware and benchmark (2025-2026)
| Hardware (system) | Model | Tokens/sec | Type | Source |
|---|---|---|---|---|
| 8x NVIDIA B200 | Llama 2 70B | 98,443 (server) | Aggregate, 8-GPU | NVIDIA (MLPerf v5.0), 2025 |
| 8x NVIDIA H200 | Llama 2 70B | 33,072 (server) | Aggregate, 8-GPU | NVIDIA (MLPerf v5.0), 2025 |
| 8x NVIDIA HGX B200 | Llama 2 70B | 101,611 (server) | Aggregate, 8-GPU | Nebius (MLPerf v5.1), 2025 |
| 8x NVIDIA HGX B200 | Llama 3.1 405B | 1,660 (offline) | Aggregate, 8-GPU | Nebius (MLPerf v5.1), 2025 |
| 1x NVIDIA DGX B200 (8 GPU) | Llama 4 Maverick | 72,000 | Aggregate (peak server) | NVIDIA, 2025 |
| 1x NVIDIA B200 (per GPU) | gpt-oss-120B | ~60,000 | Aggregate, per-GPU peak | NVIDIA / SemiAnalysis (InferenceMAX), 2025 |
| 8x NVIDIA B200 | gpt-oss-120B | 92,909 | Aggregate (peak system) | Artificial Analysis, 2026 |
| 8x NVIDIA B200 | gpt-oss-120B | 403 per query | Single-stream | Artificial Analysis, 2026 |
| 1x NVIDIA DGX B200 (8 GPU) | Llama 4 Maverick | 1,038 per user | Single-stream | NVIDIA, 2025 |
Why does H200 to B200 to GB200 change the numbers so much?
Token generation is memory-bound: each new token requires reading the model weights from memory, so memory bandwidth and interconnect dominate throughput. Blackwell B200 widened both versus Hopper H200, which is why MLPerf v5.0 showed about 3x more aggregate Llama 2 70B throughput on B200 than H200 (Source: NVIDIA, 2025).
Rack-scale designs push further by linking many GPUs over a fast fabric. NVIDIA reports GB200 NVL72 delivering roughly 15x the performance of an H200 system on a mixture-of-experts model like DeepSeek-R1 in InferenceMAX, combining higher per-GPU throughput with far more linked GPUs (Source: NVIDIA / SemiAnalysis, 2025). The lesson: aggregate throughput scales with bandwidth and GPU count, not headline FLOPs alone. For the hardware-by-hardware view, see our GPU benchmark for LLMs.
Why does one chip post two very different tokens/sec numbers?
Because batching trades latency for throughput. A server can run one request at low latency and modest total output, or pack hundreds of requests together for huge aggregate output at higher per-user latency. NVIDIA frames this as a Pareto frontier: the best achievable trade-off curve between datacenter throughput (tokens/sec per GPU) and responsiveness (tokens/sec per user) (Source: NVIDIA, 2025).
On that curve, gpt-oss-120B on a B200 reaches roughly 60,000 tokens/sec per GPU at low interactivity, but settles near 30,000 tokens/sec per GPU once you hold each user at 100 tokens/sec (Source: NVIDIA / SemiAnalysis, 2025). Neither number is wrong. They are different operating points, which is exactly why a throughput benchmark must state the latency target it held.
How do batching and concurrency drive aggregate throughput?
Aggregate throughput rises with concurrency until the hardware saturates. In a 2025 serving comparison on LLaMA-2-7B, vLLM reached 15,243 tokens/sec at 100 concurrent requests, far above the 4,156 tokens/sec of an alternative server, with the gap widening as concurrency grew (Source: arXiv, 2025). More in-flight requests means more weight reads amortized across more tokens.
The catch is latency. The Sarathi-Serve research showed that scheduling for throughput can serve about 3.5x more capacity than a baseline under a strict 100ms latency target, but the right comparison is always capacity at a fixed latency budget, not raw tokens/sec (Source: OSDI / Sarathi-Serve, 2024). A throughput number without a latency target tells you almost nothing about production behavior.
Do specialized accelerators win on throughput too?
On per-user speed, specialized inference chips lead clearly. On Llama 4 Maverick, Artificial Analysis measured Cerebras at 2,522 tokens/sec per user and NVIDIA Blackwell at 1,038, with SambaNova at 794 and Groq at 549 (Source: Cerebras / Artificial Analysis, 2025). These wafer-scale and deterministic-ASIC designs keep weights in on-chip SRAM, sidestepping the HBM round-trips that pace GPUs.
But aggregate throughput is a different contest, and it is where the published record is thinner. The leaderboard below ranks single-stream speed, the metric these vendors actually publish. Read it as a latency ranking, not a throughput ranking.
Single-stream token generation speed: Llama 4 Maverick (May 2025)
| Provider / hardware | Tokens/sec per user | Type | Source |
|---|---|---|---|
| Cerebras (WSE-3) | 2,522 | Single-stream | Cerebras / Artificial Analysis, 2025 |
| NVIDIA Blackwell (DGX B200) | 1,038 | Single-stream | NVIDIA / Artificial Analysis, 2025 |
| SambaNova (RDU) | 794 | Single-stream | Cerebras / Artificial Analysis, 2025 |
| Groq (LPU) | 549 | Single-stream | Cerebras / Artificial Analysis, 2025 |
| Amazon | 290 | Single-stream | Cerebras / Artificial Analysis, 2025 |
| 125 | Single-stream | Cerebras / Artificial Analysis, 2025 | |
| Microsoft Azure | 54 | Single-stream | Cerebras / Artificial Analysis, 2025 |
Where do Groq LPU and Cerebras WSE actually fit?
Groq’s LPU is built for low, stable per-user latency: on Llama 3.3 70B it sustained about 276 tokens/sec per user, holding speed across input lengths (Source: Groq, 2025). Cerebras reports gpt-oss-120B streaming at 3,000 tokens/sec per user from its wafer-scale engine (Source: Cerebras, 2025).
Both are per-user figures. Neither Groq nor Cerebras publishes a clean Tier 1-2 aggregate, concurrent-load tokens/sec number comparable to MLPerf’s server scenario, so they are best read as latency leaders rather than verified aggregate-throughput leaders. SemiAnalysis has also cautioned that sustained real-world throughput on these systems can run below headline marketing figures (Source: SemiAnalysis, 2025). For an apples-to-apples speed view across providers, see our LLM speed comparison.
What about Google TPU?
Google’s TPUs are real inference contenders, but the public tokens/sec data is missing. Google describes the Ironwood (v7) TPU pod at 42.5 exaflops across 9,216 chips with 1.77 PB of shared HBM, and claims TPU v6e delivers up to 4x better performance per dollar than an H100 on some workloads (Source: Google, 2025).
Those are FLOPs, bandwidth, and price-performance ratios, not output tokens/sec. As of this update, no Tier 1-2 source publishes an absolute per-user or aggregate token generation speed for Ironwood or Trillium that can be verified the way MLPerf or InferenceMAX numbers can. That gap is itself a finding: TPU inference throughput is widely deployed but not transparently benchmarked in tokens/sec.
How should you read a throughput benchmark before you commit?
Read four things in order. First, is the number per-user or aggregate? The same B200 server shows 403 tokens/sec per query and 92,909 aggregate on gpt-oss-120B (Source: Artificial Analysis, 2026). Second, what latency target was held? Aggregate throughput is meaningless without it.
Third, what model, precision, and input/output lengths were used? An FP8 endpoint on a short prompt is a different test than BF16 on a long one. Fourth, when was it measured? InferenceMAX re-runs nightly and providers re-optimize constantly, so figures drift week to week (Source: NVIDIA / SemiAnalysis, 2025). Match the metric to your workload: aggregate tokens/sec per dollar for batch jobs, per-user speed for interactive apps. TokenDyno tracks live tokens/sec across providers if you want current standings rather than a static table; see TokenDyno.
Frequently asked questions
What is LLM throughput?
LLM throughput is the total number of tokens per second a system generates across all the requests it is serving at once. It measures hardware capacity under load, unlike single-stream speed, which measures what one user experiences. A B200 server can exceed 90,000 aggregate tokens/sec on a 120B model while serving each user a few hundred (Source: Artificial Analysis, 2026).
How does GPU choice affect tokens per second?
GPU choice drives tokens/sec mainly through memory bandwidth and interconnect, since token generation is memory-bound. In MLPerf v5.0, eight B200 GPUs delivered about 98,443 aggregate tokens/sec on Llama 2 70B versus 33,072 for eight H200 GPUs, roughly 3x from one generation (Source: NVIDIA, 2025). Rack-scale GB200 systems widen the gap further.
What’s the difference between throughput and latency?
Throughput is total tokens/sec across all concurrent requests; latency is how long one user waits, captured by time-to-first-token and per-user output speed. They trade off: batching more requests raises aggregate throughput but increases each user’s latency. NVIDIA models this as a throughput-versus-interactivity Pareto frontier (Source: NVIDIA, 2025).
Is aggregate throughput or single-stream speed more important?
It depends on the workload. Interactive chat and coding assistants prioritize single-stream speed and low latency. Batch summarization, document processing, and offline evaluation prioritize aggregate throughput per dollar. The same hardware can lead on one metric and trail on the other, so pick the number that matches your traffic pattern before comparing vendors.
How often do these throughput numbers change?
Frequently, often within days. NVIDIA’s InferenceMAX benchmark re-runs nightly against improving software, and providers add, remove, or re-optimize endpoints continuously (Source: NVIDIA / SemiAnalysis, 2025). Vendor records also reflect peak configurations that may not match a production endpoint. Treat any single published figure as a dated snapshot and confirm against a live source.
Sources
- NVIDIA, Blackwell Breaks the 1,000 TPS/User Barrier With Meta’s Llama 4 Maverick (72,000 TPS/server; 1,038 TPS/user): https://developer.nvidia.com/blog/blackwell-breaks-the-1000-tps-user-barrier-with-metas-llama-4-maverick/
- NVIDIA, Blackwell Leads on New SemiAnalysis InferenceMAX Benchmarks (per-GPU throughput, Pareto frontier, GB200 NVL72): https://developer.nvidia.com/blog/nvidia-blackwell-leads-on-new-semianalysis-inferencemax-benchmarks/
- NVIDIA, Blackwell Delivers Massive Performance Leaps in MLPerf Inference v5.0 (Llama 2 70B 8x B200 vs 8x H200): https://developer.nvidia.com/blog/nvidia-blackwell-delivers-massive-performance-leaps-in-mlperf-inference-v5-0/
- SemiAnalysis, InferenceMAX open-source inference benchmark: https://newsletter.semianalysis.com/p/inferencemax-open-source-inference
- MLCommons, MLPerf Inference: Datacenter benchmark results: https://mlcommons.org/benchmarks/inference-datacenter/
- Nebius, Bare-metal-class performance on MLPerf Inference v5.1 (HGX B200 and GB200 NVL72 aggregate figures): https://nebius.com/blog/posts/bare-metal-class-performance-mlperf-inference
- Artificial Analysis, Hardware benchmarks (B200 gpt-oss-120B: 403 per query, 92,909 aggregate; system throughput definition): https://artificialanalysis.ai/benchmarks/hardware
- Artificial Analysis, Methodology (output speed and TTFT definitions): https://artificialanalysis.ai/methodology
- Cerebras, Llama 4 Maverick world-record press release (2,522 TPS/user; provider comparison set): https://www.cerebras.ai/press-release/maverick
- Cerebras, gpt-oss-120B at 3,000 tokens/sec: https://www.cerebras.ai/blog/cerebras-launches-openai-s-gpt-oss-120b-at-a-blistering-3-000-tokens-sec
- Groq, Llama 3.3 70B inference speed benchmark (276 TPS/user): https://groq.com/blog/new-ai-inference-speed-benchmark-for-llama-3-3-70b-powered-by-groq
- Google, Ironwood TPU for the age of inference (pod specs, perf-per-dollar): https://blog.google/innovation-and-ai/infrastructure-and-cloud/google-cloud/ironwood-tpu-age-of-inference/
- arXiv, GPU LLM serving throughput comparison (vLLM 15,243 TPS at 100 concurrent): https://arxiv.org/html/2511.17593v1
- Sarathi-Serve (OSDI 2024), throughput-latency tradeoff under SLO: https://arxiv.org/pdf/2403.02310
- SemiAnalysis, Cerebras sustained-throughput caveat: https://newsletter.semianalysis.com/p/cerebras-faster-tokens-please