What Is LLM Benchmarking? Why Speed Metrics Now Matter
For a decade, AI benchmarking answered one question: which model is smartest? In 2025 and 2026, that question quietly stopped being interesting, because the top models started answering it the same way. This guide defines AI and LLM benchmarking end to end, walks through the benchmark lifecycle, and makes a sourced case that speed and cost, not capability, are now the deciding axis.
Definition: AI benchmarking is the standardized process of measuring and comparing the performance of artificial intelligence systems against a fixed dataset, a defined set of tasks, and an agreed scoring method, so that two systems can be ranked on equal footing. LLM benchmarking is the subset of AI benchmarking that applies this process specifically to large language models.
What is AI benchmarking?
AI benchmarking is the practice of scoring artificial intelligence systems on fixed, repeatable tests so their performance can be compared objectively. Each benchmark bundles four parts: a sample dataset, a set of tasks or prompts, evaluation metrics, and a scoring mechanism that grades model output against a known answer or human preference (Source: IBM, 2025).
The point of benchmarking is to replace marketing claims with falsifiable numbers. “State of the art” means nothing until a fixed test, a grading rubric, and shared conditions let an independent party re-run the result and contest it. Without that structure, every vendor’s “best model” claim is unverifiable. Benchmarking is how the field converts capability into a number you can audit.
What is LLM benchmarking?
LLM benchmarking is AI benchmarking applied to large language models: standardized tests that measure how well a model reasons, codes, recalls facts, follows instructions, or holds a conversation. A benchmark runs the model through a fixed dataset, captures its answers, and grades them with an automated metric or a preference vote, rolling the result into a single comparable score, often from 0 to 100.
For a deeper structural breakdown, see What Is an LLM Benchmark?. The short version: an LLM benchmark is the instrument, and LLM benchmarking is the repeated act of using it to rank and track models across generations.
How is AI benchmarking different from LLM benchmarking?
AI benchmarking is the umbrella term covering every kind of AI system, including computer vision, speech recognition, recommendation engines, and robotics. LLM benchmarking is a narrower slice scoped to language models. Because LLMs dominate the 2025 to 2026 AI conversation, the two terms are often used interchangeably, but the broader category still includes image and multimodal tests like MMMU and ImageNet-derived suites.
The distinction matters for one reason: different system types use different metrics. A vision model is scored on accuracy or mean average precision, while an LLM is scored on pass rates, exact-match accuracy, or Elo-style preference ratings. The benchmarking method always follows the system under test.
What are the four parts of an AI benchmark?
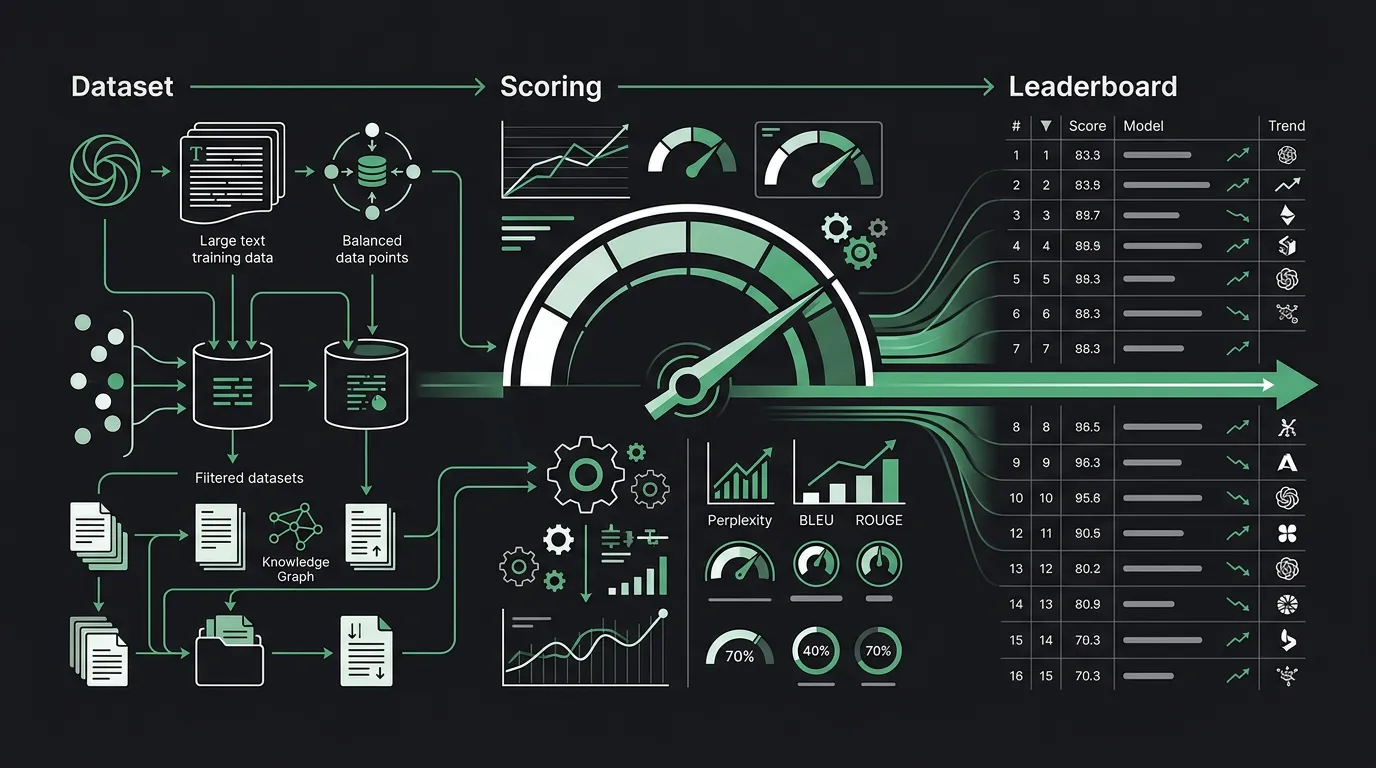
Every AI benchmark, language or otherwise, is built from four components: a dataset, a task definition, a scoring metric, and usually a public leaderboard that aggregates results. The dataset fixes the questions, the task defines what the model must produce, the metric defines correct, and the leaderboard ranks contenders (Source: IBM, 2025). Change any one part and the score changes meaning.
Understanding these parts is what separates reading a benchmark from being sold one. A 92% headline number is meaningless until you know which dataset produced it, how answers were graded, and whether the leaderboard is current. For quick definitions of the terms that recur throughout this pipeline, keep our LLM benchmarking glossary open alongside this guide.
Datasets and tasks
The dataset and task together define what a benchmark actually measures. MMLU uses 14,000-plus multiple-choice questions across 57 subjects; SWE-bench uses real GitHub issues that a model must patch in a working repository. A multiple-choice task scales cheaply to thousands of items, while a software-engineering task is stricter because the code either runs or it does not.
This is why “tested on a benchmark” is not one claim but many. A model can dominate a knowledge dataset and fail a coding dataset, because the underlying tasks reward completely different abilities.
Scoring and metrics
Scoring is where a model’s raw output becomes a number. Objective benchmarks compare answers to ground truth using exact-match accuracy or unit-test pass rates. Preference benchmarks skip ground truth entirely: LMArena shows two anonymous outputs, collects a human vote, and converts millions of votes into a Bradley-Terry rating, the Elo-style score used to rank chatbots.
The metric determines what a high score proves. A pass rate on unit tests proves working code; a preference rating proves only that people liked one answer more than another. Neither tells you how fast or how cheaply the model produced it.
Leaderboards
A leaderboard aggregates scores into a public ranking so models can be compared at a glance. Influential examples include LMArena for human preference, the Stanford HELM suite for holistic evaluation, and independent trackers that combine many benchmarks into a single index. For a current snapshot of how these rankings stack up, see the LLM Leaderboard 2026.
Leaderboards are useful and dangerous in equal measure. They compress dozens of trade-offs into one column, which is exactly why a model topping a reasoning leaderboard can still be the wrong choice for a latency-sensitive product.
What is the benchmark lifecycle?
Benchmarks are not permanent; they decay through a predictable lifecycle. A new benchmark is created to expose a capability gap, models improve until scores cluster near the ceiling (saturation), training data leakage inflates scores further (contamination), and the benchmark is eventually retired and replaced by a harder successor. MMLU to GPQA to Humanity’s Last Exam is this cycle running in real time.
The benchmark lifecycle, in five stages: (1) Creation to expose a weakness; (2) Adoption as labs report on it; (3) Saturation as top scores cluster near the maximum; (4) Contamination as benchmark data leaks into training sets and inflates scores; (5) Retirement and replacement by a harder benchmark. Each stage shortens the benchmark’s useful life.
The lifecycle is accelerating. MMLU, released in 2020, took years to saturate. GPQA Diamond, built in 2023 to be graduate-level and unsearchable, was already near 94% for frontier models by 2025 (Source: Stanford HAI AI Index, 2025). Humanity’s Last Exam, designed to resist saturation, launched in January 2025 with the best system scoring just 8.8% (Source: Stanford HAI AI Index, 2025).
Why does benchmark contamination matter?
Benchmark contamination is when test questions leak into a model’s training data, so the model recalls answers instead of reasoning them out, inflating scores. One audit estimated MMLU is roughly 29% contaminated, with one model dropping 13 points on a cleaned version of the test (Source: Pebblous, 2025). Contamination across popular QA benchmarks has been measured anywhere from 1% to 45%.
Contamination is hard to remove because it survives paraphrasing. Labs filter out text that overlaps with benchmark questions, but reword a question, translate it, or reshape a table, and the same item becomes a new string that slips past the filter (Source: Pebblous, 2025). This is a core reason different models can converge on inflated, indistinguishable scores: they may be memorizing the same leaked data rather than genuinely reasoning.
Why are capability benchmarks converging?
Capability benchmarks are converging because the leading models now score within a hair of each other on nearly every established test. On the Chatbot Arena (LMArena) leaderboard, the gap between the best US model and the best Chinese model shrank from 9.3% in January 2024 to just 1.7% by February 2025 (Source: Stanford HAI AI Index, 2025). When the spread is under two points, the ranking is statistical noise.
This convergence is structural, not temporary. The classic suite, MMLU, GSM8K, HumanEval, and HellaSwag, is largely solved, with frontier models clustered above 88% to 90% on each (Source: Stanford HAI AI Index, 2025). Stanford’s own framing is that as raw capability commoditizes, “competitive advantages come from implementation excellence, specialized applications, and deployment efficiency rather than raw model capabilities alone” (Source: Stanford HAI AI Index, 2025).
The harder successor benchmarks confirm the same story from the other side. Frontier systems solve only about 2% of FrontierMath problems and started near single digits on Humanity’s Last Exam (Source: Stanford HAI AI Index, 2025). A handful of labs chase those ceilings, but for the vast majority of production tasks, the practical capability difference between the top several models is now negligible. For the broader definitional picture, see AI Benchmarking.
Why do speed and cost benchmarks now matter most?
Speed and cost benchmarks now matter most because when models converge on capability, the deciding differences are how fast and how cheaply they answer. Independent benchmarking firm Artificial Analysis tests live API endpoints on a fixed cadence, measuring output tokens per second, time-to-first-token, and end-to-end latency, because those axes increasingly separate models that look identical on capability scores (Source: Artificial Analysis, 2026).
This is the contrarian-but-sourced thesis of this article: as capability commoditizes, benchmarking is shifting from “how smart” to “how fast and how cheap.” The evidence sits in three places.
Tokens per second and latency
Speed differences between providers are now enormous, far larger than any capability gap. While typical GPU-based providers generate 50 to 100 tokens per second, Cerebras reports 1,000 to 3,000 tokens per second on open-weight models like Llama and Qwen (Source: Cerebras, 2025). Artificial Analysis independently benchmarked Groq running Llama 3.3 70B at 276 tokens per second, the fastest of all providers it tested at the time (Source: Groq, 2025).
A 20x throughput spread dwarfs a 1.7-point capability spread. For real-time products like voice agents, time-to-first-token decides whether the experience feels instant or sluggish, and that number now varies by an order of magnitude across providers running the identical model.
Cost per token and commoditization
Token prices are collapsing, which pushes price and speed to the front as differentiators. Epoch AI found LLM inference prices have fallen rapidly, though unequally across tasks (Source: Epoch AI, 2025). Gartner projects that by 2030, running inference on a one-trillion-parameter model will cost providers over 90% less than in 2025 (Source: Gartner, 2026).
As the per-token price of comparable capability trends toward zero, it stops being a useful sorting key, and throughput per dollar takes over. Gartner cautions buyers not to “confuse the deflation of commodity tokens with the democratization of frontier reasoning,” but for the commodity-grade tasks that make up most production volume, cost and speed are the live variables (Source: Gartner, 2026).
The agentic multiplier
Agentic workflows make speed compound, turning latency into the dominant cost. Gartner estimates that agentic AI tasks require 5 to 30 times more tokens than a standard chatbot exchange, because a single user request can trigger a chain of 10 to 20 model calls (Source: Gartner, 2026). When latency stacks across every step, throughput decides whether an agent is usable at scale.
This is why benchmarking is reorienting around speed. A half-second delay per call is invisible in a single chat turn and crippling across a 20-step agent loop. The model that wins is not the one a point higher on a saturated reasoning test, but the one that finishes the whole task fastest at acceptable quality. Live speed leaderboards like TokenDyno exist precisely to track that axis.
How should you read benchmarks in 2026?
Read benchmarks as a two-layer decision: use capability scores to shortlist, then use speed and cost benchmarks to choose. Because the top models cluster within roughly two points on capability (Source: Stanford HAI AI Index, 2025), the capability layer mostly tells you who qualifies, not who wins. The speed-and-cost layer, where differences run 10x to 20x, is where the actual decision lives.
Always check three things before trusting a number: which dataset produced it, whether that benchmark is saturated or contaminated, and how recent the measurement is. A current tokens-per-second reading on your target model beats a six-month-old capability headline for nearly every production choice.
Frequently asked questions
What is AI benchmarking?
AI benchmarking is the standardized process of measuring and comparing the performance of artificial intelligence systems against a fixed dataset, defined tasks, and an agreed scoring method. It replaces vague claims like “state of the art” with falsifiable numbers that an independent party can re-run and contest (Source: IBM, 2025).
What is LLM benchmarking?
LLM benchmarking is AI benchmarking applied to large language models. It runs a model through a fixed set of prompts, grades the answers with an automated metric or human preference vote, and produces a comparable score measuring skills like reasoning, coding, knowledge, and instruction-following (Source: IBM, 2025).
Why do speed benchmarks matter now?
Speed benchmarks matter now because leading models have converged on capability, with the top systems within about 1.7 points on major leaderboards (Source: Stanford HAI AI Index, 2025). When intelligence is near-identical, tokens-per-second, latency, and cost per token, which vary by 10x or more, become the deciding factors.
What is benchmark contamination?
Benchmark contamination is when test questions leak into a model’s training data, so it recalls answers instead of reasoning them out, inflating scores. One audit estimated MMLU is about 29% contaminated, and contamination across popular benchmarks ranges from 1% to 45%, which can make distinct models look deceptively similar (Source: Pebblous, 2025).
Are AI benchmarks still useful if models are converging?
Yes, but their role has shifted. Capability benchmarks now mainly shortlist qualified models rather than crown a single winner, because top scores cluster near the ceiling (Source: Stanford HAI AI Index, 2025). Speed and cost benchmarks, where gaps remain wide, do the actual deciding for production deployments.
Sources
- IBM, “What are LLM benchmarks?” (2025). https://www.ibm.com/think/topics/llm-benchmarks
- Stanford HAI, “2025 AI Index Report: Technical Performance” (2025). https://hai.stanford.edu/ai-index/2025-ai-index-report/technical-performance
- Pebblous, “LLM Benchmark Contamination: MMLU Data Leakage” (2025). https://blog.pebblous.ai/blog/llm-benchmark-contamination/en/
- Artificial Analysis, “Language Model Benchmarking Methodology” (2026). https://artificialanalysis.ai/methodology
- Cerebras, “Introducing Cerebras Inference: AI at Instant Speed” (2025). https://www.cerebras.ai/blog/introducing-cerebras-inference-ai-at-instant-speed
- Groq, “New AI Inference Speed Benchmark for Llama 3.3 70B” (2025). https://groq.com/blog/new-ai-inference-speed-benchmark-for-llama-3-3-70b-powered-by-groq
- Epoch AI, “LLM inference prices have fallen rapidly but unequally across tasks” (2025). https://epoch.ai/data-insights/llm-inference-price-trends
- Gartner, “Gartner Predicts That by 2030, Performing Inference on an LLM With 1 Trillion Parameters Will Cost GenAI Providers Over 90% Less Than in 2025” (2026). https://www.gartner.com/en/newsroom/press-releases/2026-03-25-gartner-predicts-that-by-2030-performing-inference-on-an-llm-with-1-trillion-parameters-will-cost-genai-providers-over-90-percent-less-than-in-2025