LLM Benchmark Leaderboard: Quality vs Speed Rankings
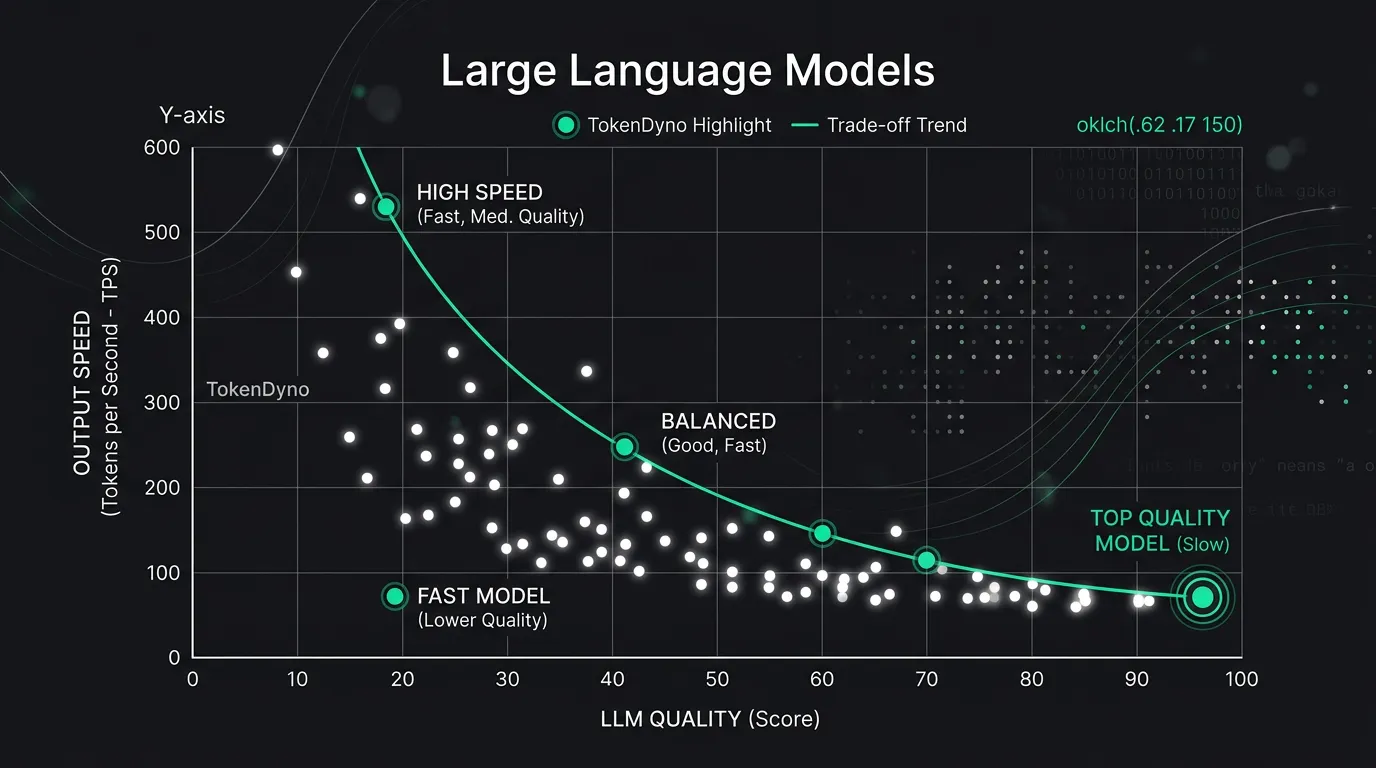
On a quality leaderboard, the top model is the one that answers best. On a speed leaderboard, it is the one that streams the most tokens per second. These are different axes, and as of mid-2026 they rarely point to the same model. Artificial Analysis data shows the highest-scoring model on its Intelligence Index runs at roughly 62 tokens/second, while the fastest tracked model streams over 850 tokens/second at less than half that quality score (Source: Artificial Analysis, 2026). Most public leaderboards report only the first axis. This piece puts both in one table, with every figure verified per row, and argues that a production decision needs to read both.
Why do most LLM leaderboards rank quality but not speed?
Most public leaderboards rank quality because capability is the headline question and speed is harder to define. Quality is a property of the model. Speed is a property of a model running on a specific provider’s hardware, so a single “tokens/sec” number does not exist until you fix the serving stack. Boards like Arena rank capability alone (Source: Arena, 2026).
What does a quality leaderboard actually measure?
A quality board measures how well a model answers, using one of a few grading families: human-preference votes fit to a Bradley-Terry model (Arena), unit-test pass rates for code, or accuracy on multiple-choice batteries. Artificial Analysis aggregates several of these into its Intelligence Index v4.1, combining GPQA Diamond, Humanity’s Last Exam, Terminal-Bench, SciCode, and other evaluations into one capability number (Source: Artificial Analysis, 2026). None of these touch latency or throughput. For the mechanics behind those scores, see LLM Benchmark Leaderboard: How Rankings Are Built.
Why is speed harder to rank than quality?
Speed depends on three things a quality test ignores: the hardware, the provider’s serving configuration, and current load. The same open-weights model can run 30x faster on one provider than another, so a speed ranking has to specify model and provider together, then re-measure constantly. That operational overhead is why most academic and preference boards skip it, and why the boards that do report speed treat it as live, rolling data rather than a fixed score.
What does the data show about the quality-speed gap?
The gap is large and consistent. Pairing each model’s Artificial Analysis Intelligence Index with its measured output speed shows an inverse pattern at the frontier: the highest-quality models all run under 80 tokens/second, while every model above 250 tokens/second scores below 35 on intelligence (Source: Artificial Analysis, 2026). The table below pairs both figures, taken from the same source on the same day so each row is internally consistent.
| Model | AA Intelligence Index | Output speed (tokens/sec) |
|---|---|---|
| Claude Opus 4.8 (max) | 56 | 62 |
| GPT-5.5 (xhigh) | 55 | 78 |
| GLM-5.2 (max) | 51 | 123 |
| Gemini 3.5 Flash | 50 | 164 |
| Qwen3.7 Max | 46 | 198 |
| Grok 4.3 (high) | 38 | 142 |
| Step 3.7 Flash | 30 | 388 |
| Mercury 2 | 25 | 857 |
Source: Artificial Analysis LLM Leaderboard, accessed 2026-06-28 (figures from a 72-hour rolling measurement window; they shift over time).
The ordering by quality is almost the reverse of the ordering by speed. The capability leader sits near the bottom of the speed column; the speed leader sits near the bottom of the quality column. No single model occupies the top of both.
Is the highest-quality model also the fastest?
No. As of this update, Claude Opus 4.8 (max) tops the Artificial Analysis Intelligence Index at 56 but streams about 62 tokens/second, slower than GPT-5.5 (xhigh) at 78 t/s and far slower than Gemini 3.5 Flash at 164 t/s, which scores 50 (Source: Artificial Analysis, 2026). The capability leader is mid-pack at best on throughput, and a model two points lower on quality can run nearly three times faster.
Why does higher quality usually mean lower speed?
The frontier quality models are reasoning models: they generate hidden reasoning tokens before the visible answer, spending compute that never reaches the user as output. More internal deliberation raises benchmark scores but lowers effective throughput and adds latency. Mercury 2, a diffusion-style model built for raw speed, tops the output-speed ranking at 857 tokens/second but scores 25 on the Intelligence Index, roughly half the frontier (Source: Artificial Analysis, 2026). The mechanism that buys quality is the same one that costs speed.
Is there any model strong on both axes?
A few sit on the efficient frontier rather than at either extreme. GLM-5.2 (max) pairs an Intelligence Index of 51 with 123 tokens/second, and Qwen3.7 Max pairs 46 with 198 t/s (Source: Artificial Analysis, 2026). These are not the smartest or the fastest models, but they dominate the middle: nothing faster is as smart, and nothing smarter is as fast. For latency-sensitive products, the best choice is often a point on this frontier, not the #1 row of the quality board.
How much does speed vary for the same model?
Enormously, because speed is set by the provider, not the model. The same model can be the fastest or the slowest option you can buy depending on whose hardware serves it. For gpt-oss-120b, Artificial Analysis measured Cerebras at 1,753 tokens/second against DeepInfra at 51.7 tokens/second for the identical weights, a 33.9x spread (Source: Artificial Analysis, 2026). The table below shows the range across tracked providers.
| Provider (gpt-oss-120b) | Output speed (tokens/sec) |
|---|---|
| Cerebras | 1,753.0 |
| SambaNova | 692.7 |
| Fireworks | 690.1 |
| Together AI | 563.5 |
| Groq | 477.6 |
| DeepInfra | 51.7 |
Source: Artificial Analysis gpt-oss-120b provider benchmark, 2026 (live measurements; values move with load).
The lesson is that “how fast is model X” has no answer. The same effect shows on closed models: across tracked providers for DeepSeek R1 (0528), output speed ranged from about 147.7 tokens/second on Google Vertex down to roughly 59.9 on DeepInfra, a 433% difference for one model (Source: Artificial Analysis, 2026). A quality score is one number per model; a speed score is one number per model-provider pair. A leaderboard that collapses speed into a single row per model is hiding most of the variance.
Which leaderboard ranks LLM speed?
Few do. Artificial Analysis is the main public board that reports both an Intelligence Index and measured output speed per model and per provider, with latency (time to first token) alongside (Source: Artificial Analysis, 2026). Preference boards such as Arena rank quality from human votes and publish no speed column (Source: Arena, 2026). HELM and similar academic boards rank capability under fixed prompts and likewise omit throughput.
Where do the speed numbers come from?
Speed boards measure by routing standardized prompts through each provider’s live API and averaging tokens per second over a rolling window, rather than trusting vendor claims. Artificial Analysis samples single-request speed eight times a day and parallel-load speed twice a day, then reports a 72-hour rolling figure (Source: Artificial Analysis, 2026). This is why the numbers in this post carry a date and will drift. For a deeper look at how throughput is measured, see Fastest LLM Inference in 2026. TokenDyno publishes a live tokens/sec leaderboard in the same spirit; treat any single snapshot, here or elsewhere, as a reading rather than a constant.
How should you read both axes when choosing a model?
Read them as a trade-off curve, not a single ranking. Pick the quality floor your task actually needs, then choose the fastest model that clears it, and finally choose the fastest provider for that model. Reversing the order, starting from the #1 quality row, often buys capability you cannot use at a latency your product cannot afford.
When does quality outrank speed?
For low-volume, high-stakes work, such as legal drafting, complex code review, or research synthesis, the quality leader is usually worth its slower stream because a wrong answer costs more than a slow one. Here, paying for Claude Opus 4.8 or GPT-5.5 at 60 to 80 tokens/second is rational even though faster models exist (Source: Artificial Analysis, 2026). The user waits seconds; the alternative is rework.
When does speed outrank quality?
For high-volume, interactive, or agentic workloads, where the model is called thousands of times or streams to a waiting user, throughput dominates. A model on the efficient frontier at 150 to 200 tokens/second can finish a multi-step agent loop in a fraction of the wall-clock time of a 60 t/s frontier model, and the small quality gap rarely changes the outcome. For why this belongs in the ranking at all, see Why Tokens/sec Belongs in Every LLM Ranking.
How fresh is this data, and why does it change?
Every figure here is a snapshot, not a constant. Artificial Analysis reports output speed on a 72-hour rolling window, re-measured several times a day, and the Intelligence Index is re-run as new model versions ship (Source: Artificial Analysis, 2026). Arena scores shift daily as human votes accumulate, and its top tier currently clusters within a tight confidence band where the #1 slot rotates (Source: Arena, 2026). Provider speeds move with hardware upgrades and load. The pattern, quality and speed pointing at different models, is stable; the exact rows are not. Re-check the live boards before any decision, and trust the methodology over any single number.
Frequently asked questions
Is the best LLM also the fastest?
Almost never. On the Artificial Analysis leaderboard, the Intelligence Index leader, Claude Opus 4.8 (max) at 56, runs about 62 tokens/second, while the speed leader, Mercury 2 at 857 t/s, scores 25 on quality (Source: Artificial Analysis, 2026). Frontier reasoning models trade throughput for capability, so the smartest model and the fastest model are different rows.
Which leaderboard ranks LLM speed?
Artificial Analysis is the main public board that ranks measured output speed (tokens/sec) and latency alongside its Intelligence Index, per model and per provider (Source: Artificial Analysis, 2026). Most quality boards, including Arena, rank capability from human votes or accuracy tests and publish no speed column (Source: Arena, 2026). Speed boards re-measure continuously because throughput depends on the live serving stack.
How do quality and speed rankings differ?
Quality is one number per model, fixed by capability tests. Speed is one number per model-provider pair, set by hardware and load, and it moves daily. The same model, gpt-oss-120b, ran 33.9x faster on Cerebras than on DeepInfra in the same benchmark (Source: Artificial Analysis, 2026). A quality ranking and a speed ranking measure different things and rarely agree on order.
Why is the same model faster on one provider than another?
Because speed reflects the provider’s hardware and serving configuration, not the model’s weights. Specialized inference chips and optimized stacks can multiply throughput several-fold over commodity GPUs. For DeepSeek R1 (0528), tracked provider speeds ranged across a 433% spread (Source: Artificial Analysis, 2026). To compare fairly, fix both the model and the provider before reading a tokens/sec figure.
Does a higher Intelligence Index always mean slower responses?
Not always, but usually at the frontier. Top-scoring models are reasoning models that generate hidden tokens before answering, which lowers effective speed. Mid-frontier models like GLM-5.2 (51 / 123 t/s) and Qwen3.7 Max (46 / 198 t/s) show you can hold high quality at several times the throughput of the #1 model (Source: Artificial Analysis, 2026). The trade-off is steep only at the very top.
Key takeaways
A quality leaderboard and a speed leaderboard answer different questions, and as of mid-2026 they crown different models. The Artificial Analysis data shows the capability leader running near the bottom of the speed column and the speed leader near the bottom of the quality column, with no model topping both (Source: Artificial Analysis, 2026). Speed is not even a fixed model property: the same weights vary up to 33.9x across providers.
To choose well, read both axes. Set the quality floor your task needs, pick the fastest model that clears it, then pick the fastest provider for that model. Prefer the efficient frontier (GLM-5.2, Qwen3.7 Max) over the #1 quality row for latency-sensitive work, and always re-check the live boards, because every number here is a dated snapshot, not a constant.
Sources
- Artificial Analysis, LLM Leaderboard (Intelligence Index and Output Speed), 2026: https://artificialanalysis.ai/leaderboards/models
- Artificial Analysis, gpt-oss-120b API Provider Performance Benchmark, 2026: https://artificialanalysis.ai/models/gpt-oss-120b/providers
- Artificial Analysis, DeepSeek R1 (0528) API Provider Performance Benchmark, 2026: https://artificialanalysis.ai/models/deepseek-r1/providers
- Artificial Analysis, OpenAI’s GPT-5.5 is the new leading AI model (Intelligence Index v4.1 methodology), 2026: https://artificialanalysis.ai/articles/openai-gpt5-5-is-the-new-leading-AI-model
- Arena (formerly LMArena), Text Leaderboard, 2026: https://arena.ai/leaderboard