LLM Benchmark Leaderboard: How Rankings Are Built
Last updated: 2026-06-28
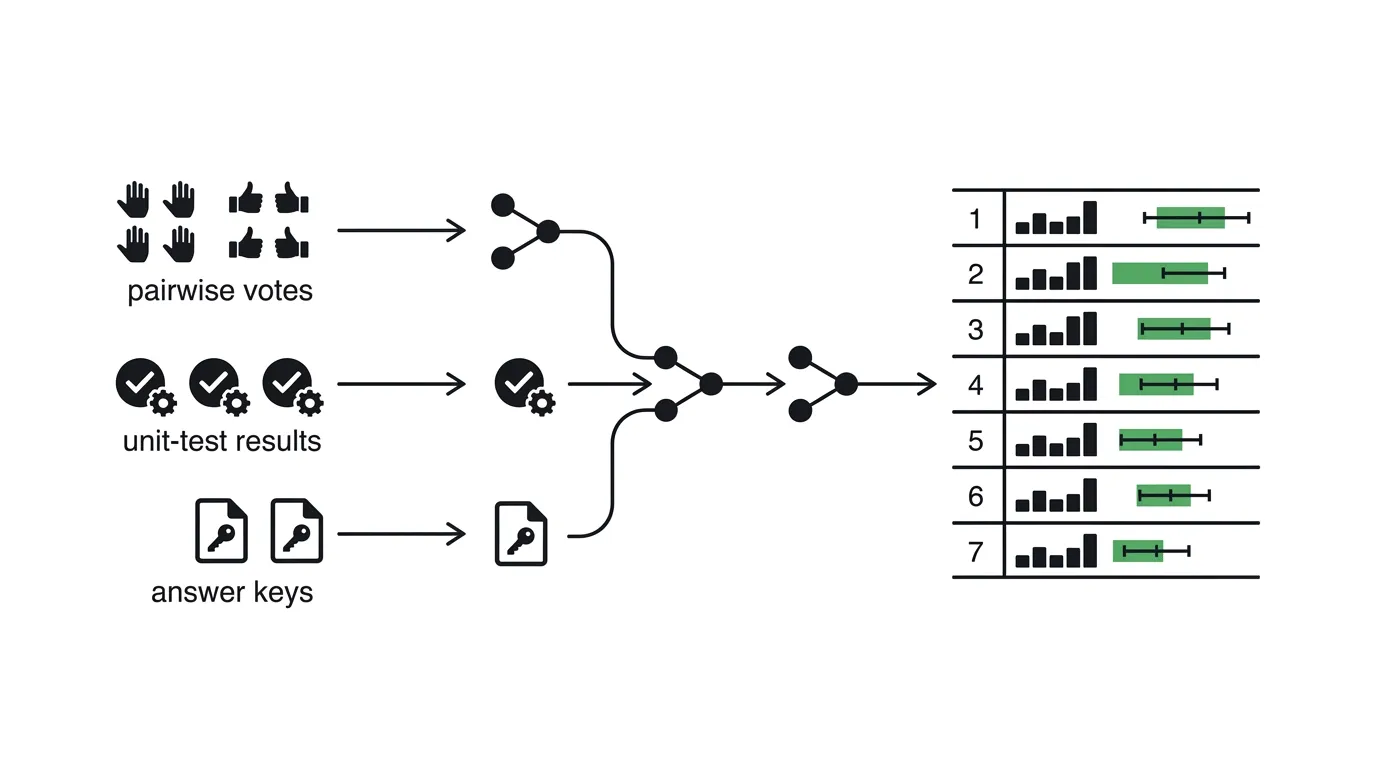
A benchmark leaderboard looks like a simple sorted list, but the number next to each model is the output of a specific statistical pipeline: a grading rule, an aggregation method, and an uncertainty estimate. Three families dominate: Bradley-Terry (the math behind Arena “Elo”) for human-preference battles, pass@k for code, and accuracy for multiple-choice tests. This guide explains how each score is computed, how models get evaluated, how contamination is controlled, and how to read a ranking without being misled by it.
What is an LLM benchmark leaderboard?
An LLM benchmark leaderboard is a ranked table that aggregates evaluation results for many models into one comparable score per model. It standardizes the task, the grading rule, and the aggregation so models can be compared directly. Leading public examples include LMArena, Stanford’s HELM, and Hugging Face’s archived Open LLM Leaderboard, which evaluated 4,576 models before closing to submissions in March 2025 (Source: Hugging Face, 2024).
The list is the easy part; the methodology is everything. A leaderboard makes three hidden choices on your behalf: which dataset defines the task, which rule converts a model’s raw output into a score, and which function collapses many per-item scores into one rank. Change any of the three and the order can move. Understanding those choices is the difference between reading a leaderboard and being steered by one.
How is an LLM leaderboard ranked?
There is no single ranking formula. Leaderboards use one of three scoring families matched to the task type: Bradley-Terry maximum-likelihood for human-preference battles, the pass@k estimator for code graded by unit tests, and accuracy (raw or normalized) for multiple-choice questions. Each produces a per-model score that is then sorted, usually with confidence intervals attached (Source: Arena, 2025; Source: Chen et al., 2021).
The grading rule depends entirely on whether the task has a verifiable answer. Code either passes its tests or it does not. A multiple-choice question has one correct letter. But “which reply is more helpful” has no answer key, so those tasks are scored by comparison instead of correctness. The sections below walk through each family.
How does Elo and Bradley-Terry work for preference arenas?
For open-ended chat, there is no ground truth, so arenas score models by pairwise human votes. LMArena collects blind side-by-side comparisons, then fits a Bradley-Terry model: a logistic regression over all battle outcomes that estimates each model’s relative strength. The coefficients are rescaled into Elo-like ratings using R = scale x beta + initial rating (Source: LMSYS, 2023).
The “Elo” label is partly historical. LMArena originally used an online Elo update, where a rating changes after each game, but switched to a Bradley-Terry maximum-likelihood fit because it gives more stable ratings and precise confidence intervals and is not sensitive to the order battles arrive in (Source: LMSYS, 2023). Beating a strong opponent moves your score more than beating a weak one, and ties count as half a win and half a loss. In 2025, LMArena open-sourced this as the Arena-Rank package under Apache 2.0, adding closed-form confidence intervals, a reweighting feature for models with fewer battles, and a 30x speedup over the old FastChat implementation (Source: Arena, 2025).
How does pass@k work for code benchmarks?
Code benchmarks have a verifiable answer: the unit tests. The pass@k metric, introduced with HumanEval’s 164 hand-written problems, reports the probability that at least one of k generated samples passes every test for a problem. It is the standard grading rule for code generation (Source: Chen et al., 2021).
The subtlety is statistical. The naive shortcut, 1 - (1 - pass@1)^k, is biased because it assumes independence and sampling with replacement. The Codex paper instead defines an unbiased estimator: generate n samples per problem (n >= k), count c that pass, and compute the expectation of 1 - C(n-c, k) / C(n, k), which is the chance that a random draw of k from n is not all failures (Source: Chen et al., 2021). This without-replacement formulation, implemented in Hugging Face’s evaluate library, lets different models be compared fairly even when sampled at different counts.
How does accuracy work for multiple-choice tests?
For multiple-choice benchmarks like MMLU-Pro or GPQA, the score is accuracy: the fraction of questions answered correctly, often using zero-shot chain-of-thought prompting with regex extraction of the final answer (Source: Stanford CRFM, 2025). It is the simplest rule because each question has exactly one correct option.
Raw accuracy has a fairness flaw across a mixed battery: an easy benchmark where everything scores 85% contributes the same as a hard one where models cluster near random guessing. Hugging Face’s Open LLM Leaderboard v2 fixed this with normalized accuracy, rescaling each benchmark so random performance is 0 and a perfect score is 100 before averaging, so each test counts according to how far a model rises above chance (Source: Hugging Face, 2024).
How is a ranking built, step by step?
A leaderboard ranking is built in a repeatable seven-stage pipeline: define the task, choose a metric, collect outputs, grade them, aggregate into one score, attach a confidence interval, then publish with contamination checks. The same skeleton holds whether the board uses Bradley-Terry, pass@k, or accuracy (Source: Arena, 2025; Source: Stanford CRFM, 2025).
Here is the sequence a leaderboard follows to turn raw model outputs into a published rank:
- Define the task and dataset. Fix the questions, prompts, or battle format. HELM Capabilities, for example, downsamples each scenario to 1,000 instances for tractability (Source: Stanford CRFM, 2025).
- Choose a scoring metric. Match the rule to the task: Bradley-Terry for votes, pass@k for code, accuracy for multiple choice.
- Collect raw outputs. Either gather model completions under a fixed prompt and harness, or, for arenas, collect human pairwise votes.
- Grade each output. Run unit tests, apply an answer key, or, for free-form tasks, use an LLM-as-a-judge. HELM’s Omni-MATH scenario queries three different judge models and averages their votes (Source: Stanford CRFM, 2025).
- Aggregate into one score. Fit the Bradley-Terry MLE, average pass@k across problems, or take a normalized mean across benchmarks.
- Compute confidence intervals. Use bootstrap or closed-form methods so each score carries an uncertainty band.
- Publish with contamination controls. Apply n-gram overlap checks, canary detection, and community flagging before the rank goes live.
Which ranking method maps to which benchmark type?
Each scoring family pairs with a benchmark type and a real leaderboard that uses it. The table below maps the method to the task it grades and a named source, so you can identify which math sits behind any board you read. No method is universal; the right one depends on whether the task has a verifiable answer (Source: Arena, 2025; Source: Chen et al., 2021; Source: Stanford CRFM, 2025).
| Ranking method | Benchmark type | Example leaderboard | Source |
|---|---|---|---|
| Bradley-Terry MLE (Elo-scaled) | Human-preference pairwise battles | LMArena | Arena, 2025 |
| pass@k (unbiased estimator) | Code generation graded by unit tests | HumanEval / SWE-bench | Chen et al., 2021 |
| Raw accuracy | Multiple-choice QA | MMLU-Pro, GPQA | Stanford CRFM, 2025 |
| Normalized accuracy (random=0, max=100) | Mixed multiple-choice battery | Open LLM Leaderboard v2 | Hugging Face, 2024 |
| Mean score (rescaled 0-1) | Mixed scenarios, judged + objective | HELM Capabilities | Stanford CRFM, 2025 |
| Mean win rate (Borda-style) | Cross-scenario aggregate (classic) | HELM Classic / Lite | Stanford CRFM, 2025 |
Note that aggregation choices change over time. HELM moved from mean win rate to a simple mean score for its Capabilities leaderboard, because mean win rate depends on the exact set of models being compared and is sensitive to small scenario-score changes that can invert ranks (Source: Stanford CRFM, 2025). The aggregation function is itself a design decision, not a neutral fact.
How are confidence intervals used to read a leaderboard?
Confidence intervals are the most underused column on any leaderboard. When two models’ intervals overlap, their rank order is partly statistical noise rather than a real capability gap. LMArena computes these bands directly: its Arena-Rank package returns a rating plus lower and upper bounds, for example gemini-2.5-pro at 1124.07 with a 95% interval of 1117.61 to 1130.53 (Source: Arena, 2025).
A rank without an interval invites overconfidence. If model A scores 1502 plus or minus 8 and model B scores 1500 plus or minus 5, their intervals overlap heavily and they are statistically tied, even though A sits a row above B. This is why LMArena does not rank on score alone but considers the intervals, and why newly added models, with fewer battles, show wider bands until more votes accumulate (Source: LMSYS, 2023). When you read a board, compare interval overlap before you trust a one-rank difference.
How do leaderboards control for benchmark contamination?
Contamination, the overlap of test items with training data, can inflate scores without real capability gains, and it has retired several once-standard benchmarks. Controls include n-gram overlap filtering, embedded canary strings, and community flagging. The problem is serious enough that MMLU, HumanEval, HellaSwag, and the original GSM8K are now widely treated as compromised (Source: Survey on Data Contamination, 2025).
The detection toolkit is imperfect. GPT-3 pioneered 13-gram overlap detection to strip training data that conflicts with test sets, but n-gram methods grow resource-intensive at web scale (Source: Survey on Data Contamination, 2025). Canary strings, unique GUID markers embedded in a benchmark, can be stripped out by a bad actor, require access to model log-probabilities (so they fail on closed black-box APIs), and miss any contamination that happened before the canary was inserted (Source: Survey on Data Contamination, 2025). This is exactly why Hugging Face’s v2 leaderboard swapped its saturated v1 tests for harder benchmarks and added contamination detection plus community flagging, producing the largest reshuffling in its history (Source: Hugging Face, 2024).
How do models get submitted and evaluated?
Submission depends on the board’s design. Open leaderboards like Hugging Face’s accept community submissions and run a fixed evaluation harness; arenas like LMArena instead surface models in anonymous battles and accumulate votes; curated boards like HELM evaluate a hand-selected set under a published, reproducible prompt protocol. Each trades coverage for control differently (Source: Hugging Face, 2024; Source: Stanford CRFM, 2025).
The evaluation harness matters as much as the model. Hugging Face’s Open LLM Leaderboard ran every model through EleutherAI’s LM Evaluation Harness across six benchmarks (IFEval, BBH, MATH, GPQA, MuSR, MMLU-Pro) for an apples-to-apples comparison (Source: Hugging Face, 2024). HELM Capabilities fixes prompts per scenario, uses zero-shot chain-of-thought for multiple choice, and applies LLM-as-a-judge with averaged votes for free-form tasks, evaluating 22 models across 5 scenarios with full prompt-level transparency (Source: Stanford CRFM, 2025). For combined capability-and-speed views, live trackers such as TokenDyno add measured throughput alongside these quality scores.
Why do leaderboards disagree?
Leaderboards disagree because they make different design choices at every stage: different datasets, grading rules, aggregation functions, and prompt setups. HELM led with Gemini 2.0 Flash on its mean-score Capabilities board, while preference arenas and code boards crown other models, because each measures a different thing in a different way (Source: Stanford CRFM, 2025).
Three sources of divergence dominate. First, task type: a human-preference winner can be mediocre at unit-tested code. Second, aggregation: mean win rate and normalized mean can reorder the same raw scores. Third, methodology critiques like “The Leaderboard Illusion” (arXiv:2504.20879) document how factors such as private testing and selective disclosure can bias even a single arena’s standings (Source: The Leaderboard Illusion, 2025). The fix is not to find the one true board but to match the board’s method to your decision. For a maintained overview, see LLM Leaderboard 2026, and for the underlying tests, LLM Benchmark: A Complete Guide.
Frequently asked questions
How is an LLM leaderboard ranked?
By one of three scoring families matched to the task. Human-preference arenas fit a Bradley-Terry model to pairwise votes; code benchmarks use the pass@k unbiased estimator over unit-test results; multiple-choice tests use raw or normalized accuracy. Each yields a per-model score that is sorted, usually with confidence intervals attached (Source: Arena, 2025; Source: Chen et al., 2021).
What is Elo in LLM benchmarks?
Elo is the rating scale arenas display, but LMArena no longer uses the classic online Elo update. It fits a Bradley-Terry maximum-likelihood model to all pairwise votes, then rescales the coefficients into Elo-like numbers. This gives more stable ratings and precise confidence intervals, independent of the order battles arrive in (Source: LMSYS, 2023; Source: Arena, 2025).
What is pass@k?
pass@k is the standard code-benchmark metric: the probability that at least one of k generated samples passes all of a problem’s unit tests. To avoid bias, the Codex/HumanEval paper uses an unbiased estimator that draws k from n >= k samples without replacement, rather than the naive 1 - (1 - pass@1)^k formula (Source: Chen et al., 2021).
Why do leaderboards disagree?
Because each makes different choices: dataset, grading rule, aggregation, and prompts. A human-preference winner may be weak at unit-tested code, and aggregation methods like mean win rate versus normalized mean can reorder identical raw scores. Methodology critiques also show single-arena standings can be biased by testing practices (Source: Stanford CRFM, 2025; Source: The Leaderboard Illusion, 2025).
How do leaderboards handle benchmark contamination?
With n-gram overlap filtering, embedded canary strings, and community flagging, though each method has gaps. Canaries can be stripped, need log-probability access, and miss pre-insertion leakage. Contamination has retired MMLU, HumanEval, HellaSwag, and the original GSM8K, prompting boards to adopt harder, fresher benchmarks (Source: Survey on Data Contamination, 2025).
Why do confidence intervals matter on a leaderboard?
Because overlapping intervals mean two models are statistically tied even when one ranks higher. LMArena returns each rating with a band, such as 1124.07 from 1117.61 to 1130.53, and ranks on the interval, not the point score alone. Models with fewer battles show wider bands until more data accumulates (Source: Arena, 2025; Source: LMSYS, 2023).
Key takeaways
A leaderboard rank is a computed result, not a fact. It reflects a chosen dataset, a grading rule (Bradley-Terry, pass@k, or accuracy), an aggregation function, and an uncertainty estimate. Read those choices before you trust the order, and always check whether two adjacent models’ confidence intervals overlap, because a one-row gap can be pure noise.
To build or read a ranking correctly: match the scoring method to whether your task has a verifiable answer, prefer boards with contamination controls and fresh benchmarks, and weight speed alongside quality for production decisions. For the quality-versus-speed trade-off specifically, see LLM Benchmark Leaderboard: Quality vs Speed.
Sources
- Arena (LMArena), Arena-Rank: Open Sourcing the Leaderboard Methodology (2025): https://arena.ai/blog/arena-rank/
- LMSYS Org, Chatbot Arena: New models & Elo system update (2023): https://www.lmsys.org/blog/2023-12-07-leaderboard/
- Chen et al., Evaluating Large Language Models Trained on Code (Codex / HumanEval / pass@k), arXiv:2107.03374 (2021): https://arxiv.org/abs/2107.03374
- Stanford CRFM, HELM Capabilities (2025): https://crfm.stanford.edu/2025/03/20/helm-capabilities.html
- Hugging Face, Open LLM Leaderboard v2 launch / archive (2024): https://www.infoq.com/news/2024/10/open-llm-leaderboard-v2-launch/ ; https://huggingface.co/docs/leaderboards/en/open_llm_leaderboard/archive
- Cheng et al., A Survey on Data Contamination for Large Language Models, arXiv:2502.14425 (2025): https://arxiv.org/html/2502.14425v2
- The Leaderboard Illusion, arXiv:2504.20879 (2025): https://arxiv.org/pdf/2504.20879