LLM Inference Speed Benchmark: Methodology and Metrics
Most LLM inference speed numbers you see are not comparable. A “fast” claim measured on a 200-token prompt, a single request, and a warm cache will not survive a 10,000-token prompt under concurrency. The difference is not noise: across published methodologies, the same model can vary several-fold depending on prompt length, batch size, tokenizer, and load. Speed only means something once those variables are fixed.
This is a methodology piece, not a leaderboard. One idea carries it: a tokens-per-second figure with no stated workload is closer to a marketing asset than a measurement. The two most rigorous public references, MLPerf Inference and the Artificial Analysis methodology, both spend more effort defining test conditions than reporting the headline number. That ordering is the point. Below are the variables that move the number and a checklist to apply before trusting any speed claim.
Why aren’t most LLM speed numbers comparable?
Most published LLM speed numbers are not comparable because the benchmark conditions differ silently. Output tokens per second depends on prompt length, batch size, concurrency, output length, cache state, and which tokenizer counts the tokens. Change any one and the headline figure moves, often by 2x or more, with no change to the underlying model (Source: Artificial Analysis, 2026).
The honest framing is that “tokens per second” is a rate with a hidden denominator. When a vendor reports 300 tokens/sec, the useful questions are: how long was the prompt, how many requests were in flight, how long was the generation, was the cache cold, and whose tokenizer did the counting? Without those, two numbers from two sources measure different things that happen to share a unit. The arXiv analysis Speed and Conversational Large Language Models argues the metric can measure the wrong thing entirely, because what users experience is task completion time, not token count (Source: arXiv, 2025).
What does “tokens per second” actually count?
Tokens per second counts model output after generation starts, but inference has two phases that behave differently. The prefill phase processes the entire input prompt and produces the first token; the decode phase generates each subsequent token sequentially. MLPerf measures these separately as Time To First Token (TTFT) and Time Per Output Token (TPOT) precisely because one number hides them (Source: MLCommons, 2025).
This split matters because prompt length loads almost entirely onto prefill. A long prompt inflates TTFT while barely changing steady-state decode speed, so a benchmark that reports only “tokens/sec” can look identical for a 500-token and a 50,000-token prompt while the user waits seconds longer for the first token. Any speed benchmark that does not separate first-token latency from output speed is averaging two phases the user feels differently. For the unit itself and how it is defined, see our primer on LLM Tokens Per Second.
How much do tokenizers distort the number?
Tokenizers distort speed comparisons because a “token” is not a fixed amount of text. Different models split the same string into different token counts, so two models generating identical readable output can report different tokens-per-second figures purely from tokenizer efficiency. Llama 3’s tokenizer is up to 15% more efficient than Llama 2’s, meaning ~85 Llama 3 tokens carry the content of 100 Llama 2 tokens (Source: Meta, 2024).
The gap is large enough to invert rankings. Anyscale measured Llama 2 tokenization as roughly 19% longer than the GPT tokenizer for the same text (Source: Anyscale, 2024). A model with an inefficient tokenizer can post a higher tokens/sec while delivering text to the user more slowly, because each token carries less meaning. This is why native-token comparisons across model families are unreliable, and why Artificial Analysis normalizes every model to one reference tokenizer, OpenAI’s o200k_base via the tiktoken library, so identical text yields identical counts (Source: Artificial Analysis, 2026). Without normalization, cross-model tokens/sec is not a fair comparison (Source: Baseten, 2025).
What are the controllable variables in a speed benchmark?
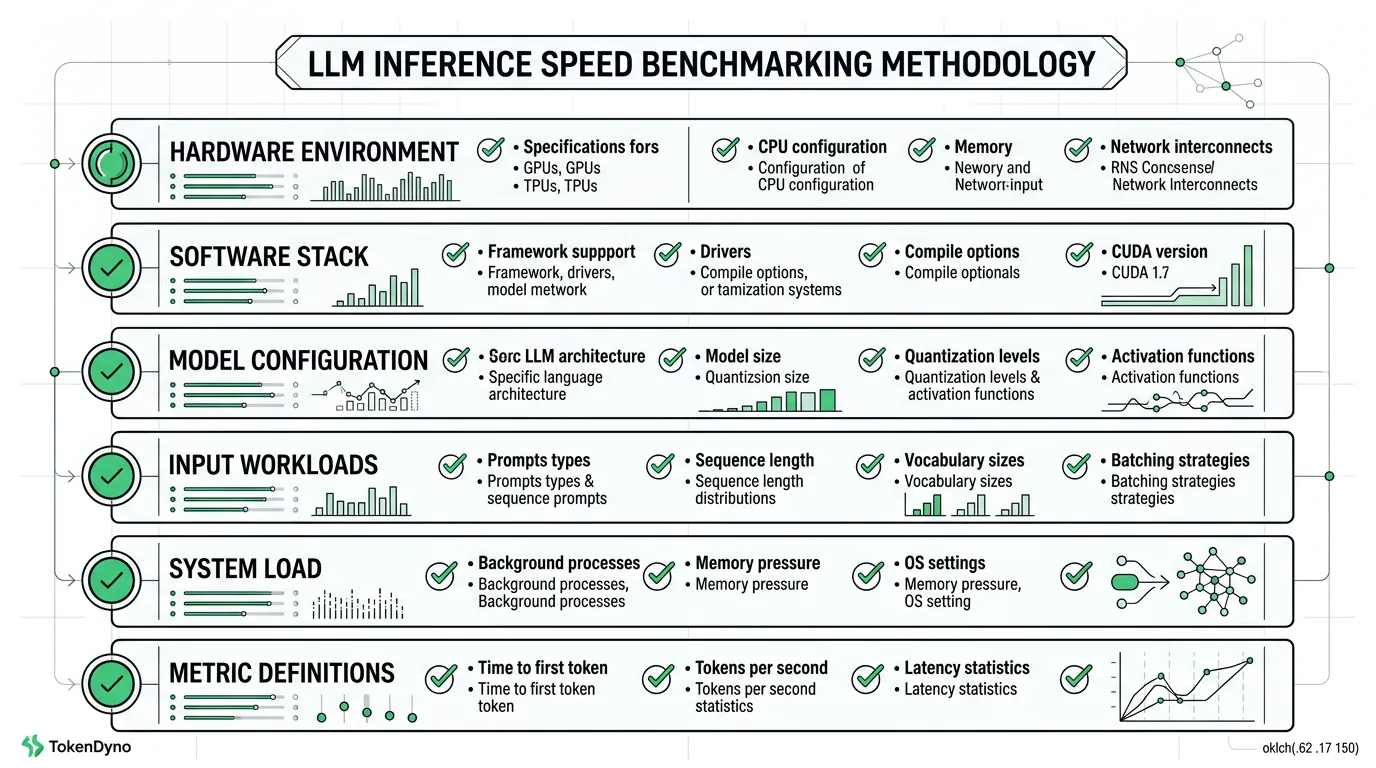
A rigorous LLM inference speed benchmark fixes six controllable variables: input length, output length, batch size, concurrency, cache state, and the tokenizer used for counting. Each one independently shifts the result. The vLLM serving benchmark exposes most of them as explicit flags because throughput is meaningless without them held constant (Source: vLLM Documentation, 2026).
These are the levers a careless benchmark leaves floating and a careful one pins down. Treat them as a contract: a speed claim is only reproducible if all six are stated. The subsections below cover the three that move the number most.
How do prompt and output length change the result?
Prompt and output length change the result by shifting where time is spent. Longer prompts increase prefill work, raising TTFT and often lowering measured output tokens/sec; longer outputs spread fixed startup cost over more decode tokens, usually raising the reported rate. Artificial Analysis controls this with fixed workloads of roughly 1,000, 10,000, and 100,000 input tokens, each with a minimum answer length (Source: Artificial Analysis, 2026).
The 10,000-token workload, their site default, requires at least 1,500 answer tokens so the decode phase is long enough to measure a stable rate (Source: Artificial Analysis, 2026). This is deliberate: short outputs make the per-token rate dominated by startup overhead and easy to inflate. A benchmark that does not pin both input and output length is reporting a rate against an unknown amount of work.
How do batch size and concurrency change the result?
Batch size and concurrency change the result because LLM serving trades latency for throughput. Aggregate tokens/sec rises as more requests run in parallel, until the GPU and KV cache saturate, after which latency climbs sharply. In one comparative study, vLLM throughput scaled up to 64 concurrent requests on an A30, while tighter-budget GPUs saturated between 16 and 32 (Source: vLLM Documentation, 2026).
This is the single biggest reason batch numbers and single-stream numbers should never be compared. A “single request” benchmark measures latency-optimal speed; a “max throughput” benchmark measures the saturated aggregate, which can be many times higher but with worse per-request latency. vLLM’s own tooling splits this into two scripts: an offline throughput benchmark for batch and KV-cache effects, and a serving benchmark with --request-rate and --max-concurrency for online load patterns (Source: vLLM Documentation, 2026). For a wider survey of the LLM benchmark tooling you can use to run these tests yourself, see our dedicated guide. For the throughput side of this tradeoff in depth, see our LLM Throughput Benchmark.
Why does cold versus warm cache matter so much?
Cold versus warm cache matters because prompt caching can make staging numbers look dramatically better than production. Cached requests run roughly 7% faster on short prompts but up to 67% faster on long ones; one 100,000-token prompt dropped from 11.5 seconds uncached to 2.4 seconds warm, an 80% reduction (Source: TianPan, 2026). A benchmark that silently reuses a warm cache is measuring the cache, not the model.
Provider caching policies vary, which makes “warm” itself ambiguous: OpenAI auto-caches prompts over 1,024 tokens, Google requires a 4,096-token minimum, and Anthropic caches prefixes on a short TTL (Source: TianPan, 2026). To isolate cold conditions, NVIDIA’s benchmarking practice inserts at least a 3-minute wait between runs so results reflect cold-start timing rather than cache hits (Source: NVIDIA, 2025). State must be reported, or the number is not reproducible.
How does MLPerf Inference standardize speed measurement?
MLPerf Inference standardizes speed by fixing scenarios, datasets, latency bounds, and an accuracy floor, then reporting tokens per second only when all are met. For LLM benchmarks it uses two metrics: token throughput for the offline scenario, and TTFT plus TPOT for the server scenario that models random query arrivals (Source: MLCommons, 2025).
The key discipline is that throughput is only valid under a latency constraint. For Llama 3.1 405B, MLPerf sets a 99th-percentile TTFT of 6 seconds and a 99th-percentile TPOT of 175 ms; for the DeepSeek-R1 reasoning benchmark, a 2-second TTFT and 80 ms TPOT at p99 (Source: MLCommons, 2025). A submission must hit those bounds and clear the accuracy criteria for the model and dataset before its tokens/sec counts. Edge submissions swap the server scenario for single-stream, scored on 90th-percentile per-sequence latency, because per-token latency does not capture whole-sequence performance (Source: MLCommons, 2025). This is what a defensible speed number looks like: latency-bounded, accuracy-gated, and scenario-specific.
What is MLPerf Inference, in one line?
MLPerf Inference is an industry-standard benchmark suite from MLCommons that measures how fast systems run inference under defined scenarios, datasets, and latency or accuracy constraints. Its v5.1 round added reasoning (DeepSeek-R1), speech-to-text (Whisper Large v3), and small-LLM (Llama 3.1 8B) benchmarks, with submissions reported in tokens per second per scenario (Source: MLCommons, 2025).
How does the Artificial Analysis methodology standardize speed?
The Artificial Analysis methodology standardizes speed by fixing the workload, normalizing the tokenizer, and reporting a median over a rolling window. It defines TTFT as time to the first token and output speed as average tokens per second after the first token, both measured against fixed 1k, 10k, and 100k input-token workloads (Source: Artificial Analysis, 2026).
The reproducibility details are what make it citable. Standard workloads run 8 times per day, roughly every 3 hours, and the published figure is the median (P50) over the past 72 hours, while the 100k workload runs weekly and reports a 14-day median (Source: Artificial Analysis, 2026). A separate parallel test sends 10 concurrent requests once per day to capture load behavior, and every run uses a fresh prompt to avoid caching artifacts (Source: Artificial Analysis, 2026). Tests run from a single Google Cloud region with fixed API parameters so location and sampling do not float between measurements (Source: Artificial Analysis, 2026). Median-over-window beats a single sample because live endpoints fluctuate hour to hour. For how these inputs assemble into a full benchmark, see our LLM Inference Benchmark guide.
What is a correct LLM inference speed benchmark checklist?
A correct LLM inference speed benchmark states every controllable variable before reporting a number. The checklist below is the minimum disclosure that makes a tokens-per-second figure reproducible and comparable. If a published claim omits any line, treat the number as indicative, not authoritative.
- Input length: the exact prompt token count (e.g., 1k / 10k / 100k), since prefill cost scales with it (Source: Artificial Analysis, 2026).
- Output length: a fixed minimum answer length, so the decode rate is not dominated by startup overhead (Source: Artificial Analysis, 2026).
- Metric split: TTFT and output tokens/sec reported separately, not merged into one figure (Source: MLCommons, 2025).
- Batch size and concurrency: single-request versus parallel load stated explicitly, with the concurrency level named (Source: vLLM Documentation, 2026).
- Cache state: cold versus warm declared, with a wait interval to force cold-start where intended (Source: NVIDIA, 2025).
- Tokenizer: the tokenizer used for counting named, and normalized to a reference (e.g.,
o200k_base) for cross-model comparison (Source: Artificial Analysis, 2026). - Latency bound and accuracy: throughput reported under a stated p99 latency constraint and an accuracy floor, as MLPerf requires (Source: MLCommons, 2025).
- Aggregation: median over a defined window rather than a single best-case sample (Source: Artificial Analysis, 2026).
- Environment: hardware, region, and API parameters fixed and disclosed (Source: Artificial Analysis, 2026).
TokenDyno applies the live-median, fixed-workload approach when surfacing speed figures, so the numbers reflect sustained endpoint behavior rather than one-off peaks.
Why do “world record” speed numbers rarely match production?
World-record speed numbers rarely match production because they are measured under conditions a real workload never sees: short prompts, single requests, warm caches, and peak hardware. Those choices stack in the vendor’s favor. Under concurrency, a model that looks fast in a controlled benchmark can stall, because aggregate throughput and per-request latency move in opposite directions past saturation (Source: vLLM Documentation, 2026).
The fix is not distrust but disclosure. A peak number is fine if it states its conditions; it misleads only when those conditions are dropped and the figure is presented as general “speed.” The academic critique goes further: even with a shared tokenizer, two models can emit different token counts for the same task, so tokens/sec still misses user-perceived speed (Source: arXiv, 2025). The defense is the checklist above. When conditions are stated, peaks and production numbers reconcile; when they are not, the comparison was never valid.
Frequently asked questions
How do you benchmark LLM inference speed?
Benchmark LLM inference speed by fixing input length, output length, batch size, concurrency, and cache state, then measuring TTFT and output tokens/sec separately under a stated latency bound. Normalize token counts to one reference tokenizer and report a median over a window, as MLPerf and Artificial Analysis do (Source: MLCommons, 2025).
Why are LLM speed comparisons often misleading?
LLM speed comparisons mislead because the conditions differ silently. Prompt length, concurrency, cache state, and tokenizer each shift tokens/sec by large margins, so two numbers sharing a unit can measure different work. A model with an inefficient tokenizer can even post a higher rate while delivering text more slowly (Source: Baseten, 2025).
What is MLPerf Inference?
MLPerf Inference is MLCommons’ industry-standard suite for measuring inference speed under defined scenarios, datasets, and latency or accuracy constraints. LLM benchmarks report token throughput for offline and TTFT plus TPOT for server scenarios, with strict p99 latency bounds such as 6-second TTFT for Llama 3.1 405B (Source: MLCommons, 2025).
What is the difference between TTFT and output tokens per second?
TTFT (Time To First Token) measures the prefill phase, how long until the first token appears, driven mainly by prompt length. Output tokens per second measures the decode phase, the steady-state generation rate after the first token. They feel different to users, so rigorous benchmarks report both separately (Source: MLCommons, 2025).
Does batch size affect tokens per second?
Yes. Aggregate tokens per second rises with batch size and concurrency until the GPU and KV cache saturate, after which latency climbs sharply. vLLM throughput scaled to 64 concurrent requests on one GPU while smaller GPUs saturated near 16 to 32, so single-request and batched numbers are not comparable (Source: vLLM Documentation, 2026).
Why normalize to a single tokenizer?
Normalization is needed because a “token” is not a fixed amount of text. Llama 3’s tokenizer is up to 15% more efficient than Llama 2’s, so native-token rates misrepresent delivered speed. Counting every model with one reference tokenizer, like OpenAI’s o200k_base, makes identical text yield identical counts (Source: Meta, 2024).
Sources
- MLCommons — MLPerf Inference v5.0 / v5.1 LLM benchmark methodology, scenarios, and latency bounds (2025). https://mlcommons.org/2025/04/llm-inference-v5/ and https://mlcommons.org/2025/09/small-llm-inference-5-1/
- Artificial Analysis — Language Model API Performance Benchmarking methodology (2026). https://artificialanalysis.ai/methodology/performance-benchmarking
- vLLM Documentation — Benchmark CLI, serving and throughput benchmarks (2026). https://docs.vllm.ai/en/latest/benchmarking/cli/
- Baseten — Comparing tokens per second across LLMs (2025). https://www.baseten.co/blog/comparing-tokens-per-second-across-llms/
- Anyscale — Llama 2 tokenization length versus GPT, via Databricks/Anyscale inference best practices (2024). https://www.databricks.com/blog/llm-inference-performance-engineering-best-practices
- Meta — Llama 3 tokenizer efficiency announcement (2024). https://ai.meta.com/blog/meta-llama-3/
- arXiv — Speed and Conversational Large Language Models: Not All Is About Tokens per Second (2025). https://arxiv.org/pdf/2502.16721
- TianPan — Cold Cache, Hot Cache: Why Your LLM Latency Numbers Lie in Staging (2026). https://tianpan.co/blog/2026-04-10-cold-cache-hot-cache-llm-latency-staging-lies
- NVIDIA — Benchmarking practice for isolating cold-start latency (2025). https://developer.nvidia.com/blog/reducing-cold-start-latency-for-llm-inference-with-nvidia-runai-model-streamer/