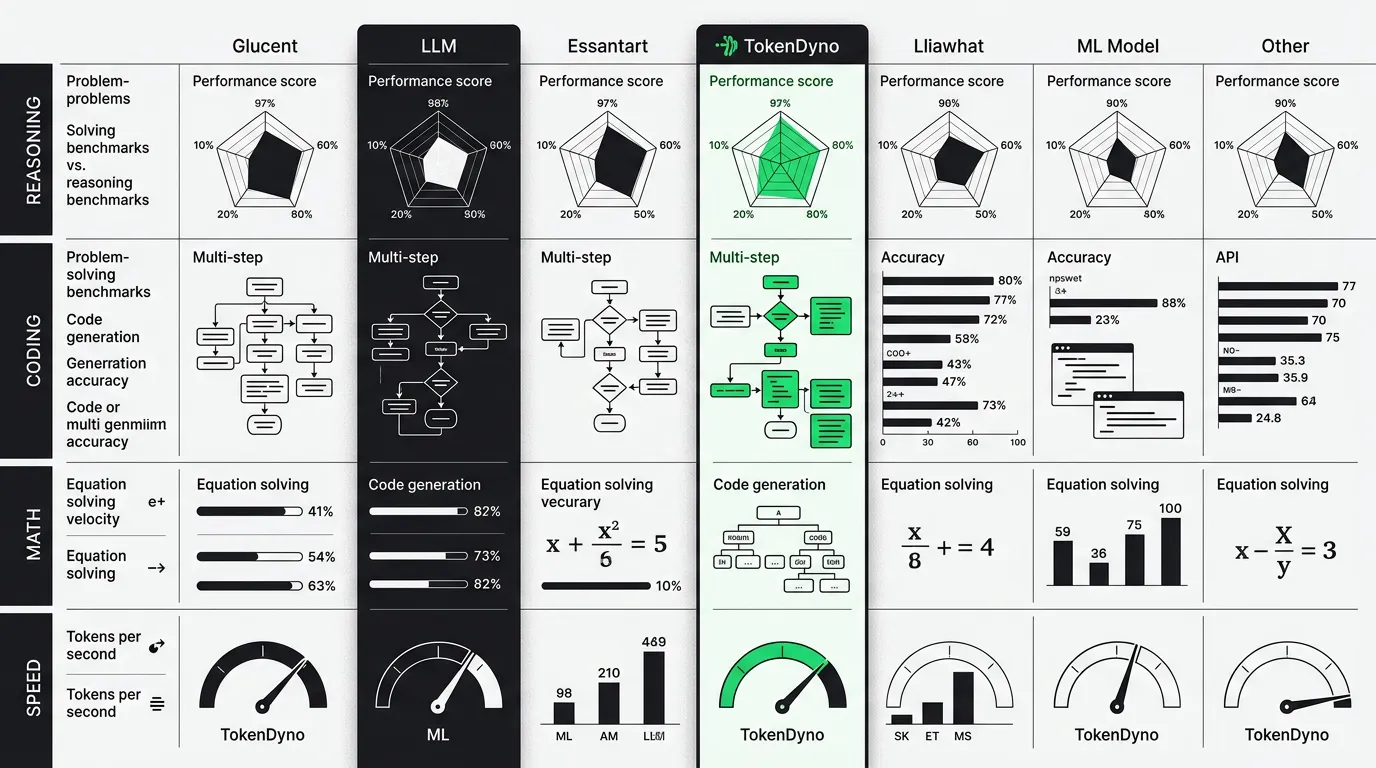
LLM Benchmark Comparison: Side-by-Side Model Evaluation
An LLM benchmark comparison is only useful when the scores are measured the same way. In practice they rarely are. A flagship model can post 100% on AIME 2025 with a Python tool and 92.8% without it (Source: Anthropic, 2025), so a clean side-by-side starts with method, not numbers. This guide builds that method.
The goal is not to crown a winner. It is to give you a repeatable framework: pick benchmarks per axis, normalize the conditions, weight by your use case, and read the result skeptically. We close with a worked side-by-side using real 2025-2026 results, including the caveats that make those numbers comparable or not.
How should you compare LLMs across benchmarks?
Compare LLMs axis by axis, not by a single headline score. Map each capability you care about (reasoning, math, coding, knowledge, speed) to one or two benchmarks, confirm every model was tested under the same conditions, then weight the axes by your workload. Skipping the conditions check is where most comparisons go wrong.
A benchmark score is a measurement taken under specific settings: a prompt format, a number of attempts, a reasoning-effort level, and sometimes external tools. Two numbers for the “same” benchmark can come from different settings and are then not comparable. Treat each published score as a data point with its metadata attached, and your comparison gets far more honest. For the underlying mechanics, see LLM Benchmark: A Complete Guide.
What does a side-by-side LLM comparison look like?
A complete side-by-side puts one model per row and one axis per column, with the source on every cell. Below are real, mostly vendor self-reported results for three well-documented frontier models from late 2025, plus two more where data is partial. Read the caveats under the table before drawing conclusions.
| Model | GPQA Diamond (reasoning) | AIME 2025 (math) | SWE-bench Verified (coding) | AA Intelligence Index (Nov 2025 version) | Output speed (tokens/sec) | Source |
|---|---|---|---|---|---|---|
| Gemini 3 Pro | 91.9% | 100% (with tools) | 76.2% | 73 | ~146 | Google, 2025; Artificial Analysis, 2025 |
| GPT-5.1 (high) | 88.1% | 94.0% | 76.3% | 70 | ~106 | Anthropic comparison table, 2025; Artificial Analysis, 2025 |
| Claude Opus 4.5 | 87.0% | 92.8% (no tools)* | 80.9% | 70 (reasoning) | 45.4 (non-reasoning) | Anthropic, 2025; Artificial Analysis, 2025 |
| DeepSeek-V3.2 | Not verified | 93.1% | 73.1% | Not verified | Not verified | llm-stats, 2026 (self-reported) |
| Grok 4 | Not verified | 91.7% | Not verified | 65 | N/A on source | llm-stats, 2026; Artificial Analysis, 2025 |
*Anthropic notes the Opus 4.5 AIME 2025 score “may have been inflated by contamination” (Source: Anthropic, Claude Opus 4.5 System Card, 2025). The Intelligence Index figures are from the version in effect at the November 2025 launch; the current v4.1 methodology (June 2026) uses a different benchmark mix and is not on the same scale (Source: Artificial Analysis, 2026). “Not verified” means no Tier 1-2 source confirmed the number at access date, 2026-06-28.
What is an LLM benchmark comparison framework?
A framework is a fixed procedure you apply to every model so the comparison is fair. It has four steps: choose axes that match your workload, assign one or two benchmarks per axis, normalize the test conditions, then weight the axes. Without it, you are comparing whatever numbers each vendor chose to publish.
The reason a framework matters is selection bias. Vendors publish the benchmarks where they lead and the conditions that flatter them. A framework forces every model through the same gate, so one that quietly omitted a weak axis cannot hide. It also makes your decision auditable: months later you rerun the procedure and see what changed. For how to choose the benchmarks themselves, see Best LLM Benchmark.
Which benchmarks map to which axis?
Assign benchmarks by what they actually test. Graduate-level reasoning maps to GPQA Diamond; competition math maps to AIME 2025; agentic coding maps to SWE-bench Verified, a 500-task human-validated subset built by the SWE-bench team with OpenAI (Source: SWE-bench, 2025). Avoid plain MMLU, which Artificial Analysis now excludes as outdated (Source: Artificial Analysis, 2026).
One benchmark per axis is the minimum; two is safer because it catches overfitting to a single test. If a model tops GPQA Diamond but lags a second reasoning benchmark, that gap is signal. Keep the axes few and concrete: four axes that each map to a real part of your workload beat twelve overlapping benchmarks you cannot act on.
How do you normalize scores across benchmarks?
Normalization means recording the conditions behind each score, then only comparing like with like. For every cell, note the reasoning-effort level, whether tools were enabled, the number of attempts, and the shot count. If two models were tested under different settings, either re-run them yourself or label the comparison as approximate.
The stakes are concrete. GPT-5.1 on AIME 2025 ranges from 94.0% at one effort setting to 99.6% at “high” on the same leaderboard (Source: llm-stats, 2026). Claude Opus 4.5 moves from 92.8% without tools to 100% with a Python tool (Source: Anthropic, 2025). A 6-point “lead” can be nothing more than a different effort tier. Normalize first, rank second.
How do you weight benchmarks by use case?
Weighting turns axes into a single decision by multiplying each axis score by how much your workload depends on it. A coding-agent product might weight SWE-bench Verified at 50%, reasoning at 30%, and speed at 20%. A high-volume chat product might flip that and weight speed and latency far higher than competition math.
Artificial Analysis publishes a worked example of weighting. Its Intelligence Index v4.1 (June 2026) aggregates nine benchmarks into four groups: Agents at 34%, Coding at 24%, Scientific Reasoning at 24%, and General at 18% (Source: Artificial Analysis, 2026). You do not have to adopt their weights, but the structure is the point: explicit weights you can defend beat an unstated gut feeling.
Why can’t you compare benchmark scores directly?
You cannot compare raw scores directly because the same benchmark name hides different test conditions, contamination, and selective reporting. A published number is a measurement plus its settings; strip the settings and you get a ranking that can invert under a fair re-test. Three failure modes cause most of the damage.
These failures are not exotic edge cases. They appear in flagship launch materials from 2025-2026, sometimes flagged by the vendors themselves. Knowing the three patterns lets you spot a misleading comparison in seconds. For how speed interacts with these quality axes, see Speed, Quality, or Both?.
Why does benchmark contamination break comparisons?
Contamination happens when benchmark questions leak into a model’s training data, inflating the score without real capability gain. It is common enough that Anthropic flagged its own Claude Opus 4.5 AIME 2025 result as possibly “inflated by contamination” (Source: Anthropic, Claude Opus 4.5 System Card, 2025). When one model is contaminated and another is not, the gap is fiction.
Contamination is hardest to detect on static, widely-published tests, and newer models have had more chances to ingest a given benchmark, so a higher score can reflect exposure rather than reasoning. Contamination-resistant benchmarks that rotate questions reduce this, which is why a clean comparison favors fresh tests over famous static ones.
Why do test conditions make scores incomparable?
Test conditions change scores by double-digit margins, so a comparison that ignores them is measuring settings, not models. Reasoning effort, tool access, attempt count, and prompt format all move results. The AIME swings above (94.0% to 99.6% by effort; 92.8% to 100% with a Python tool) are the clearest documented examples (Sources: llm-stats, 2026; Anthropic, 2025).
Even independent evaluators disagree by construction. Epoch AI runs 484 of the 500 SWE-bench Verified tasks in a network-isolated container and estimates a 5-10% benchmark error rate, and it documents a February 2026 scaffold upgrade that raised scores on its own (Source: Epoch AI, 2026). A 1-2 point SWE-bench difference is inside that noise.
Why is vendor self-reporting a problem?
Vendor self-reporting is a problem because vendors control the conditions and choose which benchmarks to publish. On the llm-stats SWE-bench Verified and AIME 2025 leaderboards, the entries are labeled self-reported and unverified, with zero independently verified rows at access date (Source: llm-stats, 2026). Self-reported is not necessarily wrong, but it is unaudited.
The fix is triangulation. Where a third party such as Artificial Analysis or Epoch AI has re-measured a model under disclosed conditions, prefer that number, and note where it differs from the vendor’s. Where only a vendor figure exists, label it as such in your comparison, exactly as the table above does. Provenance is part of the data, not a footnote.
How do three frontier models compare side by side?
Across the three best-documented late-2025 models, no single model wins every axis. Gemini 3 Pro leads reasoning, Claude Opus 4.5 leads coding, and GPT-5.1 sits between them, with speed inverting the order entirely (Sources: Google, 2025; Anthropic, 2025; Artificial Analysis, 2025). That spread is the whole argument for axis-by-axis comparison.
Read the worked axes below as a demonstration of the framework, not a buying recommendation. The numbers are mostly vendor self-reported and the standings are volatile; check the live sources before you commit, because the specific scores go stale within a release cycle.
Which model wins the reasoning and math axis?
On GPQA Diamond, Gemini 3 Pro leads at 91.9%, ahead of GPT-5.1 at 88.1% and Claude Opus 4.5 at 87.0% (Sources: Google, 2025; Anthropic comparison table, 2025). The 4.9-point spread is modest, and all three results are vendor-reported, so treat the order as a soft signal rather than a settled ranking.
On AIME 2025 the picture clouds. The headline numbers (Gemini 3 Pro 100% with tools, GPT-5.1 94.0%, Opus 4.5 92.8% without tools) were taken under different tool and effort conditions, and Anthropic flagged contamination on its own result (Sources: Google, 2025; llm-stats, 2026; Anthropic, 2025). Without normalized conditions, math is the least trustworthy column in the table.
Which model wins the coding axis?
On SWE-bench Verified, Claude Opus 4.5 leads the three at 80.9%, with GPT-5.1 at 76.3% and Gemini 3 Pro at 76.2% (Sources: Anthropic, 2025; Artificial Analysis, 2025). The Opus lead of roughly 4.5 points is the clearest gap in the comparison, though still partly inside the benchmark’s documented error band.
The caveat is saturation. SWE-bench Verified scores now cluster in the high 70s and low 80s, and scaffold changes alone move them, so it separates models less than it used to (Source: Epoch AI, 2026). If coding is your priority axis, supplement the headline score with a second coding benchmark and a trial on your own repository.
Which model wins the speed axis?
Speed inverts the quality order. On Artificial Analysis, Gemini 3 Pro outputs around 146 tokens/sec and GPT-5.1 around 106, while Claude Opus 4.5 in non-reasoning mode measures 45.4 (Source: Artificial Analysis, 2025). The model that trails slightly on reasoning leads decisively on throughput, which matters for any latency-sensitive product.
Speed numbers also carry conditions. Reasoning-tier time-to-first-token is dominated by thinking time, so a “slow” first token can reflect deliberation rather than infrastructure (Source: Artificial Analysis, 2025). Because serving speed drifts with provider load, a periodic snapshot and a continuous live tracker such as TokenDyno can disagree; validate speed on your own provider endpoint.
How do you turn a comparison into a decision?
Turn a comparison into a decision by collapsing the normalized, weighted axes into one ranked shortlist, then validating the top one or two on your own workload. Benchmarks narrow the field; they do not pick the winner. The last mile is always a trial on your real prompts, traffic, and latency budget.
A practical sequence works well. Shortlist on capability using a contamination-resistant benchmark and a weighted index, confirm the conditions behind each number, then run your finalists against a held-out set of your own tasks while measuring live speed and reliability on the exact provider you would ship on. The comparison gets you to two finalists; your own evaluation chooses between them.
Frequently asked questions
How do you compare LLM benchmarks?
Compare them axis by axis. Map each capability you care about to one or two benchmarks, record the test conditions (effort level, tools, attempts) behind every score, only compare results measured the same way, then weight the axes by your workload. A single blended leaderboard number hides exactly the conditions that decide whether the comparison is fair.
What’s the best way to compare two LLMs?
Pick three or four axes that match your use case, find each model’s score on the same benchmark under the same conditions, and prefer independently measured numbers over vendor self-reported ones. Then validate your top pick on your own tasks. Benchmarks shortlist; your own evaluation under real traffic and latency makes the final call.
Why can’t you compare benchmark scores directly?
Because identical benchmark names hide different conditions. The same model scored 92.8% on AIME 2025 without tools and 100% with a Python tool (Source: Anthropic, 2025), and effort settings swing GPT-5.1 from 94.0% to 99.6% (Source: llm-stats, 2026). Add contamination and selective vendor reporting, and raw scores can invert under a fair re-test.
Are vendor-reported benchmark scores reliable?
They are useful but unaudited. Vendors control the test conditions and choose which benchmarks to publish, and leaderboards like llm-stats label flagship SWE-bench and AIME entries self-reported with zero verified rows (Source: llm-stats, 2026). Treat vendor numbers as a starting point, prefer third-party re-measurements where they exist, and label provenance in your comparison.
What is benchmark contamination?
Contamination is when benchmark questions leak into training data, inflating a score without real capability gain. It is common enough that Anthropic flagged its own Claude Opus 4.5 AIME 2025 result as possibly inflated by it (Source: Anthropic, 2025). Contamination-resistant benchmarks that rotate questions over time reduce the effect and give cleaner comparisons.
How often do benchmark comparisons go out of date?
Within a release cycle, often a few months. Frontier standings shifted repeatedly across late 2025 and into 2026 as new model versions shipped, and benchmarks like SWE-bench Verified saw scaffold upgrades that moved scores independent of the models (Source: Epoch AI, 2026). Re-run your framework on the live sources rather than trusting a cached ranking.
Key takeaways
An LLM benchmark comparison is a method, not a leaderboard lookup. Build a framework: map each axis (reasoning, math, coding, knowledge, speed) to one or two benchmarks, normalize the test conditions, weight the axes by your workload, then rank. The conditions step is non-negotiable, because effort tiers and tool access swing single benchmarks by double digits.
The three traps are contamination, mismatched conditions, and selective vendor reporting, and all three appear in real 2025-2026 launch materials. In the worked side-by-side, Gemini 3 Pro led reasoning, Claude Opus 4.5 led coding, and speed inverted the order, with no model winning every axis. Use benchmarks to shortlist, then validate your finalists on your own tasks and your own provider before you commit.
Sources
- Anthropic, “Claude Opus 4.5 System Card” (2025): https://assets.anthropic.com/m/64823ba7485345a7/Claude-Opus-4-5-System-Card.pdf
- Anthropic / Vellum, “Claude Opus 4.5 benchmarks” comparison table (2025): https://www.vellum.ai/blog/claude-opus-4-5-benchmarks
- Google, “Gemini 3” official announcement (2025): https://blog.google/products/gemini/gemini-3/
- Artificial Analysis, “Claude Opus 4.5: Benchmarks and Analysis” (2025): https://artificialanalysis.ai/articles/claude-opus-4-5-benchmarks-and-analysis
- Artificial Analysis, Intelligence Index methodology v4.1 (2026): https://artificialanalysis.ai/methodology/intelligence-benchmarking
- Artificial Analysis, model and provider pages (2025-2026): https://artificialanalysis.ai/models
- llm-stats, SWE-bench Verified leaderboard (2026): https://llm-stats.com/benchmarks/swe-bench-verified
- llm-stats, AIME 2025 leaderboard (2026): https://llm-stats.com/benchmarks/aime-2025
- SWE-bench, “Verified” definition (2025): https://www.swebench.com/verified.html
- Epoch AI, SWE-bench Verified independent evaluation (2026): https://epoch.ai/benchmarks/swe-bench-verified